
Alternative Statistical Facts – 2017 Employment Trends in Canada’s Major Cities
GWLRA monitors economic change as well as momentum in Canada’s metropolitan regions. Overall employment trends tend to be a strong real estate demand indicator—in all asset classes. However, interpreting employment statistics is often as much art as science. This year-end, especially so.
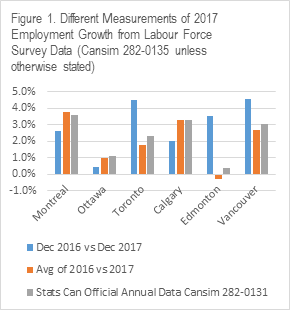
Different ways of evaluating employment change result in different views of job growth and momentum. For example, as shown in Figure 1, Edmonton is either experiencing surprisingly strong job growth, or is contracting. Vancouver and Toronto are either among the top employment growth centres in North America or closer to the continental average. Calgary and Montreal appear solid irrespective of measurement tool used.
Overall growth in 2017 is a valuable data point as it reflects underlying strength in real estate demand.
However, looking ahead, it is momentum that helps us form expectations for the coming year and set short-term tactical strategies for assets.
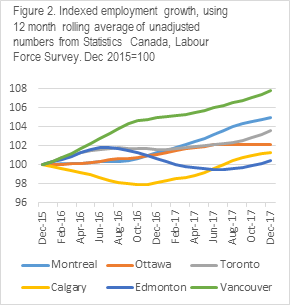
The Canadian metro areas featured showed strong employment momentum in the back half of 2017, save for flat Ottawa. Figure 2 offers a 24 month trend, smoothed out using the 12 month rolling average of employment, and indexed to show percentage change and compare different-sized markets.
These two charts together help reveal the likely “true” employment trends. After a weak first half of 2017, Edmonton is seeing employment growth. Meanwhile, Calgary’s momentum from 1H 2017 has eased, but the direction still appears solid although could also be in a modest slump; this is something to monitor in Q1 2018.
In the Toronto area, after a flat 2016 and 1H 2017 employment growth has accelerated, reaching an annualized pace of over 3% during the past quarter. And Vancouver employment continues to grow after a brief weak period in late 2016.
The December-on-December numbers (blue bars in Figure 1) that suggest robust growth in most markets may contain a statistical anomaly. One possible explanation is that December 2017 had a strong boost from unusually high seasonal part-time employment. This is why we look for “alternative statistical facts” in the rolling averages over a longer time period.

Leading the national Research and Strategy team, Wendy’s responsibilities include providing economic, demographic and market-trends analysis to support long-term asset acquisition, development and management strategies. Wendy has been working in real estate research since 2002, including over a decade with GWL Realty Advisors. She holds a Ph.D. in comparative-world and economic history from the University of Arizona.