
Holding Steady: Institutional Investment in Canada’s Secondary Markets
Smaller cities in Canada can provide institutional property investors added diversification and depending on the stage of the cycle, attractive income returns compared to large regional markets.
MSCI’s Canadian Property Index offers a consistent source from which to examine trends in institutional capital flows to secondary markets. The MSCI Property Index aggregates portfolio and investment data for ‘institutional’ investors such as pensions, insurance companies and direct property funds; secondary market investments in this case are defined as the assets MSCI is tracking outside of the major VECTOM [1] markets.
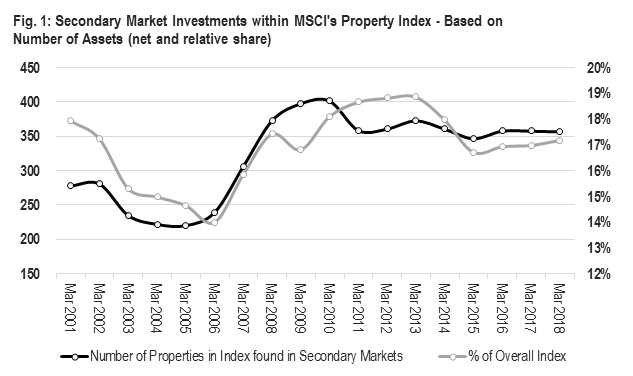
Figure 1 highlights that institutional investment in secondary markets has generally been stable the last several years based on property count. After quickly rising in total assets between 2006 and 2010, secondary market investment as a share of the index currently stands at 17%, slightly lower than the peak high of 19% seen in 2013. The lower share reflects significant investment growth in major markets, thereby lowering the weighting of properties in smaller cities. The actual number of properties in secondary markets has been stable since 2011.
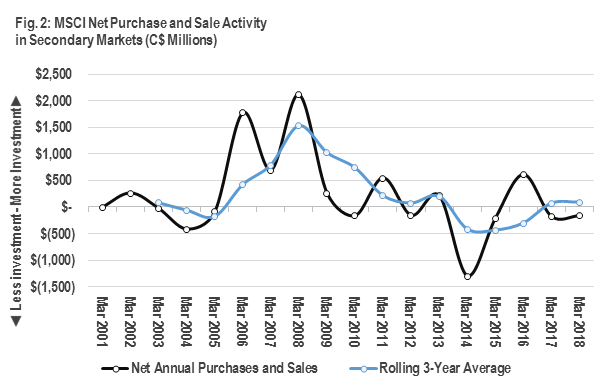
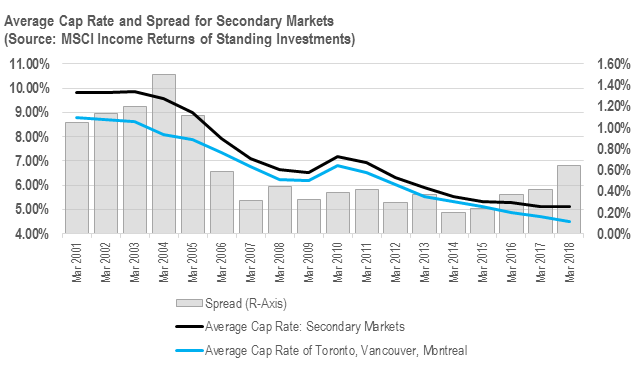
Investment volume in secondary markets is further reflective of this stability: looking at the aggregate purchase and sale activity within the MSCI Property Index over the long term, Figure 2 shows that ‘net’ investment activity (purchases less sales) in secondary markets has moderated the last several years, particularly compared to 2006 to 2008 levels. This moderating pace of investment activity in secondary markets is also reflected in cap rates: compared to Vancouver, Toronto and Montreal markets, for example, which continue to see yield compression, cap rates for secondary markets have stabilized in recent years (Figure 3).
The data above highlights some interesting themes. From a market allocation perspective, 2005 to 2009 marked the largest shift for institutional investors towards secondary markets—the number of assets in secondary markets grew 80% over those years. Cap rates in secondary markets as well as their spread to core markets also declined considerably. The dynamic over this current cycle is different. Investors generally appear comfortable with their current exposure to secondary markets and relative pricing for assets.
Accordingly, the findings suggest that the investment benefits secondary markets offer investors is evolving. With secondary markets having a smaller yield advantage over this cycle, diversification and access to product increasingly appear to be reasons. One trend to watch however, is the trajectory of cap rates between core and secondary markets—secondary markets may look increasingly attractive if the spread continues to widen.
VECTOM : abbreviation for Canada’s largest cities: Vancouver, Edmonton, Calgary, Toronto, Ottawa and Montreal

Based in Vancouver, Anthio brings more than 15 years of experience to GWLRA’s Research and Strategy team specializing in property market analysis, applied research and portfolio strategy. He has a Master’s in Urban Planning and Development from the University of Toronto.