Taking Stock: A New Approach For Quantifying Industrial Demand
Investor interest in industrial assets increased through the pandemic as demand from tenants surged. Shelter-in-place policies accelerated demand for online shopping, expanding warehouse and logistics requirements.
While e-commerce was already a growing trend before COVID-19, McKinsey estimates that ten years of e-commerce adoption was compressed into three months early in the pandemic.1 Consumer surveys suggest continued growth in online sales post-COVID, albeit at a more modest rate, even as economies are set re-open and a rebound in physical shopping occurs.
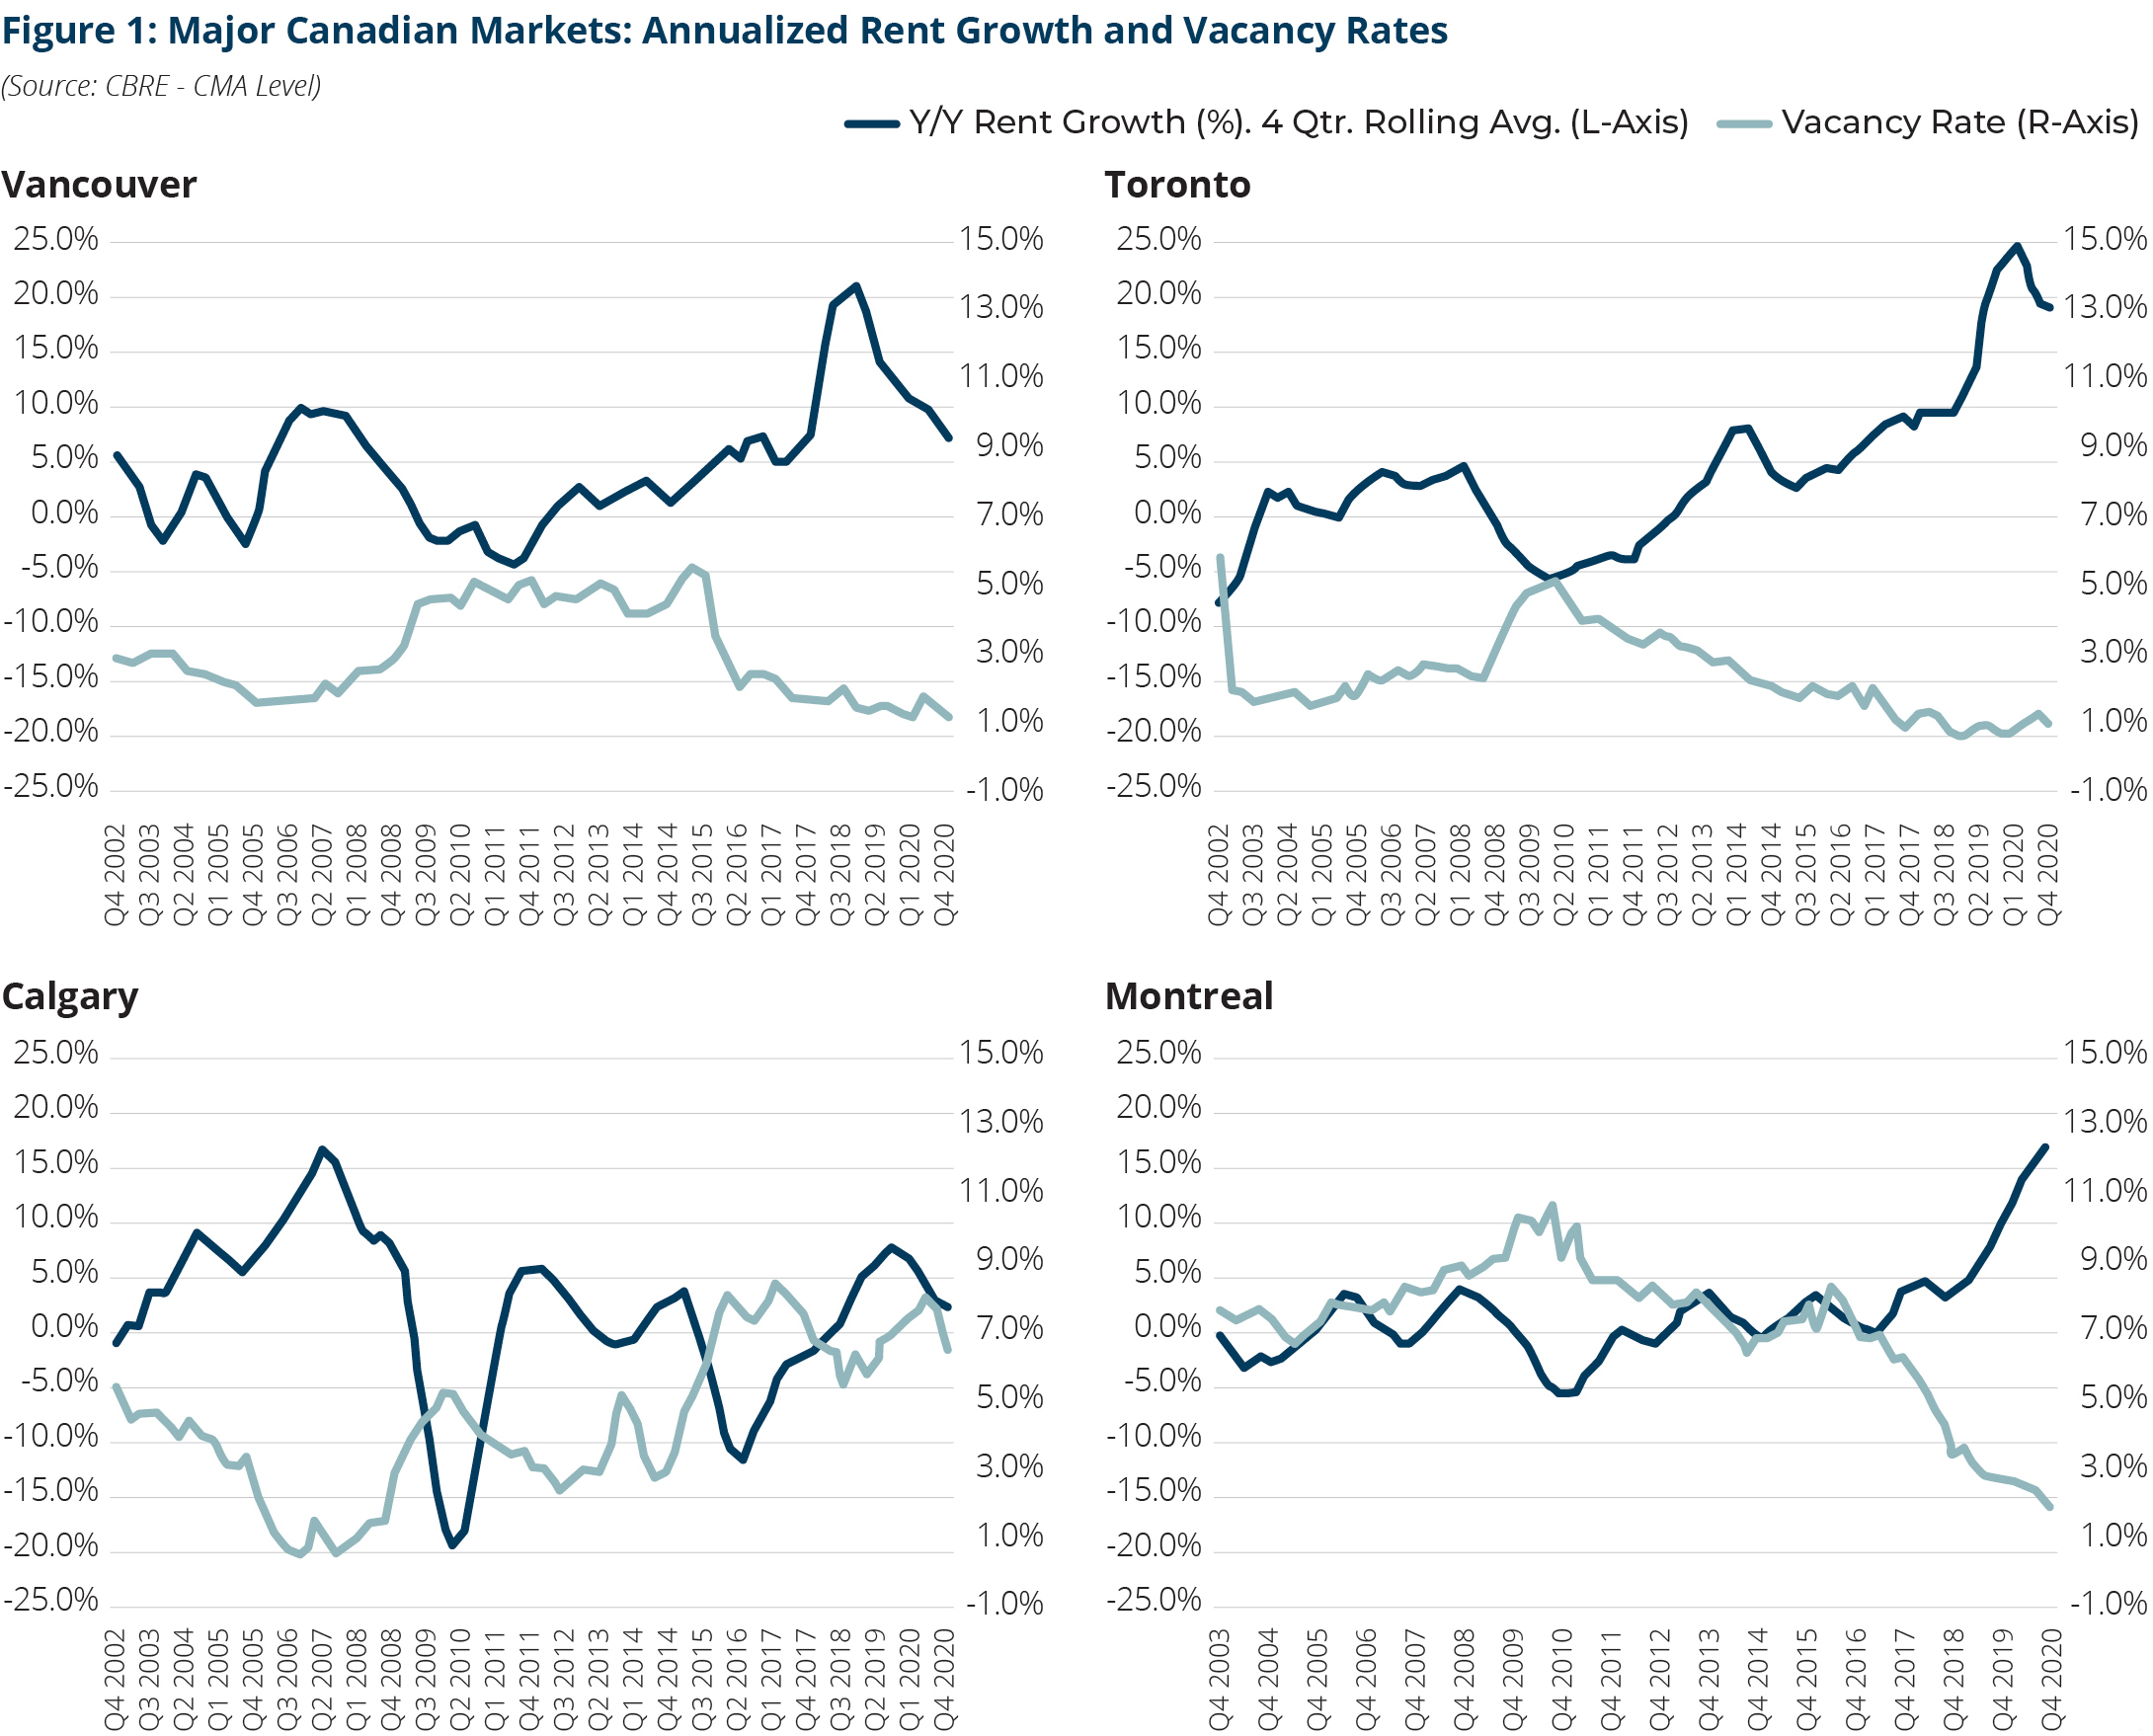
With vacancy rates in major Canadian markets among the lowest in North America, rents for industrial product have surged in recent years. Even with disruptions to global supply chains and consumer spending the past 12 months, rents averaged 10%-20% annualized growth nationally for 2020 (Figure 1). Vancouver, Montreal and Toronto in particular have seen rents appreciate 50%-90% on a total net basis between 2015 and 2020.
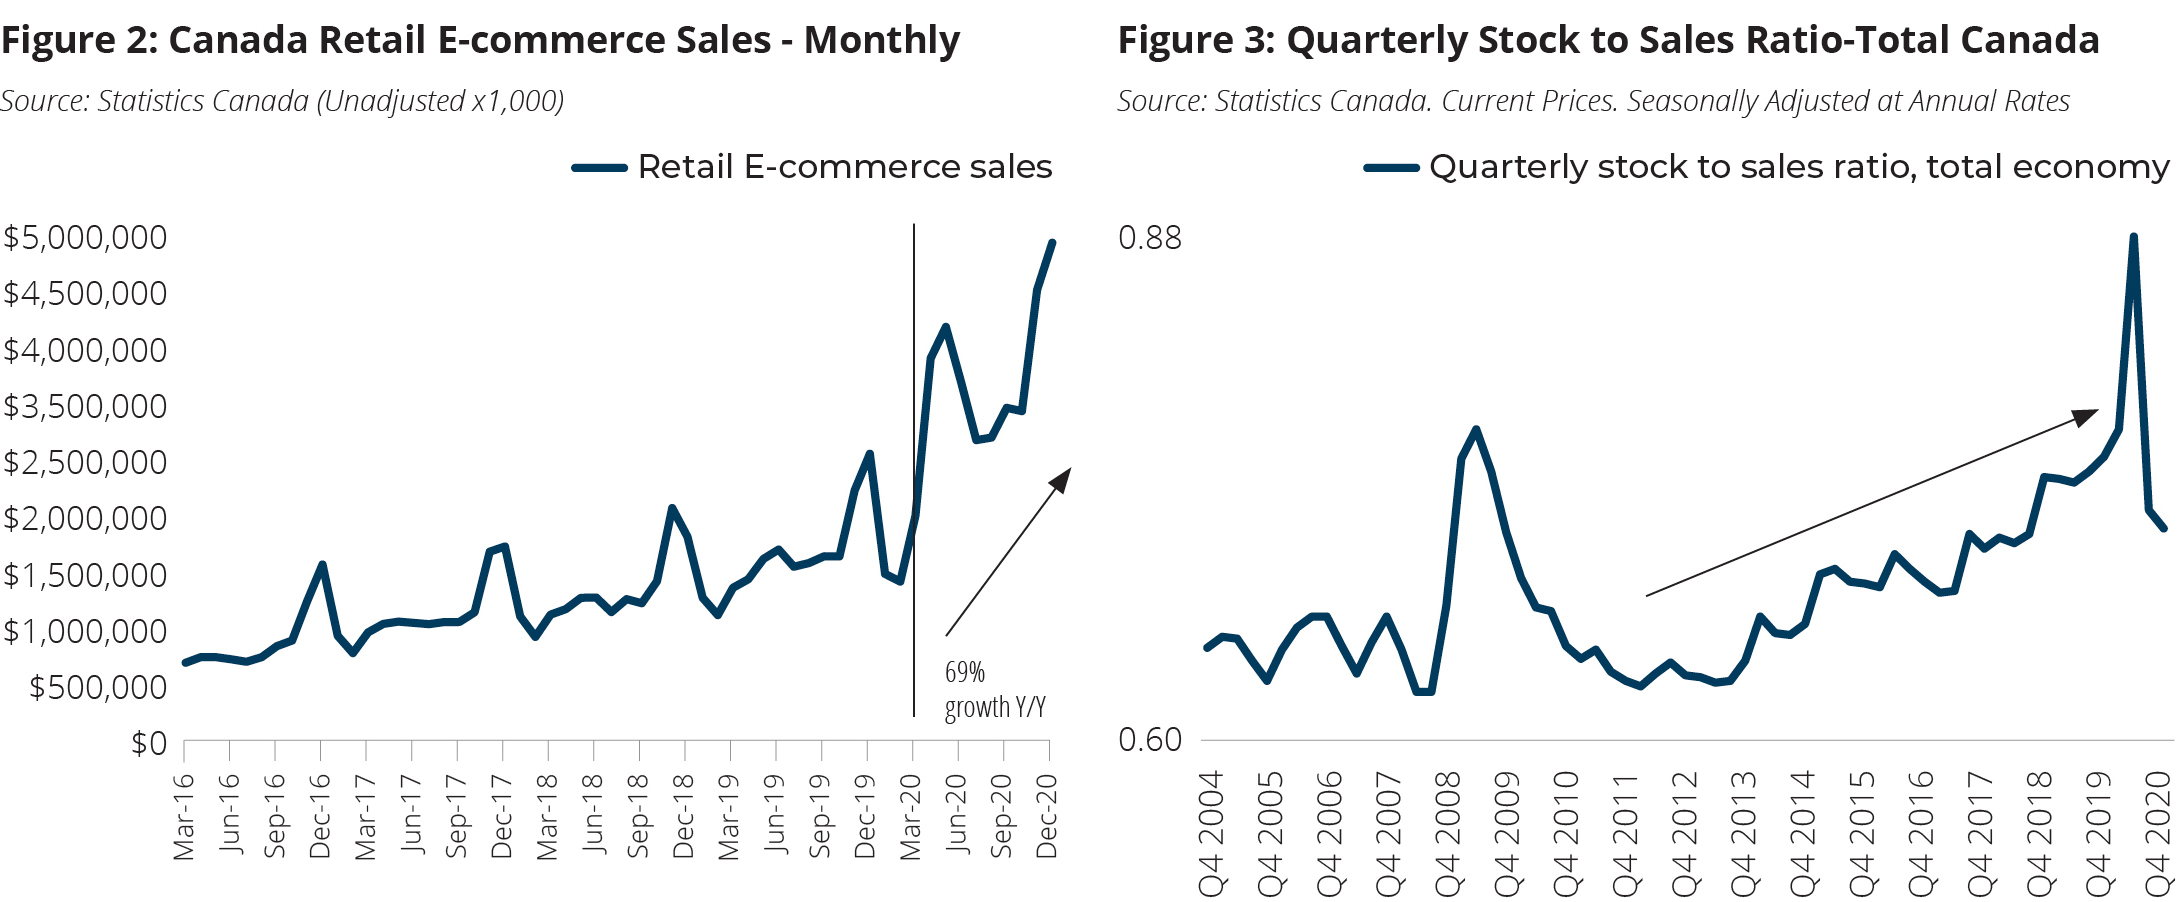
If we look historically across most major Canadian markets, industrial vacancy rates from 2002-2007 were nearly as low as we see today; rents however, grew at much slower rates. Indeed, the rise of online shopping helps explain why rents are much stronger over this cycle; as noted in Figure 2 and 3, Canadian e-commerce sales as well as the national inventory to sales ratio have been trending structurally higher the last decade with COVID creating a further ‘spike’ in 2020. Products purchased online are more warehouse intensive: individually ordered products require more physical space and labour than goods destined for store shelves. Reverse logistics and the need for multiple distribution points (home, store, parcel centre) add to the complexity of the modern retail supply chain. In 2020, intermittent closure of retail stores further forced retailers to hold higher levels of un-sold inventory at local facilities.
Low vacancies do not drive increases in market rents alone, however; from our internal analysis, it is the level of property demand relative to supply that influences the direction of rents. While macro-factors such as online shopping provide an overall indicator for market demand, the link to rent growth is not direct. Demand in this case, needs to be quantified more fulsomely to understand its relationship to rent growth (and more importantly, its change over time).
GWLRA’s Leading Industrial Index
Accordingly, GWLRA’s focus in recent years has been trying to measure this supply-demand imbalance across major Canadian industrial markets. To visualize this, GWLRA’s Research Team built a proprietary Index that tracks demand and supply levels across major Canadian markets. Developed using a custom weighted selection of leading industrial variables – some directly tied to e-commerce growth and others tied to regional economic activity – the Index emerged as a statistically significant predictor of forward rent growth. Both cyclical and structural factors drive the index, including retail sales, demand momentum, future supply, and warehouse inventory levels.
Using the Toronto market as a case study, Figure 4 below shows the relative demand and supply scores for the regional industrial market.
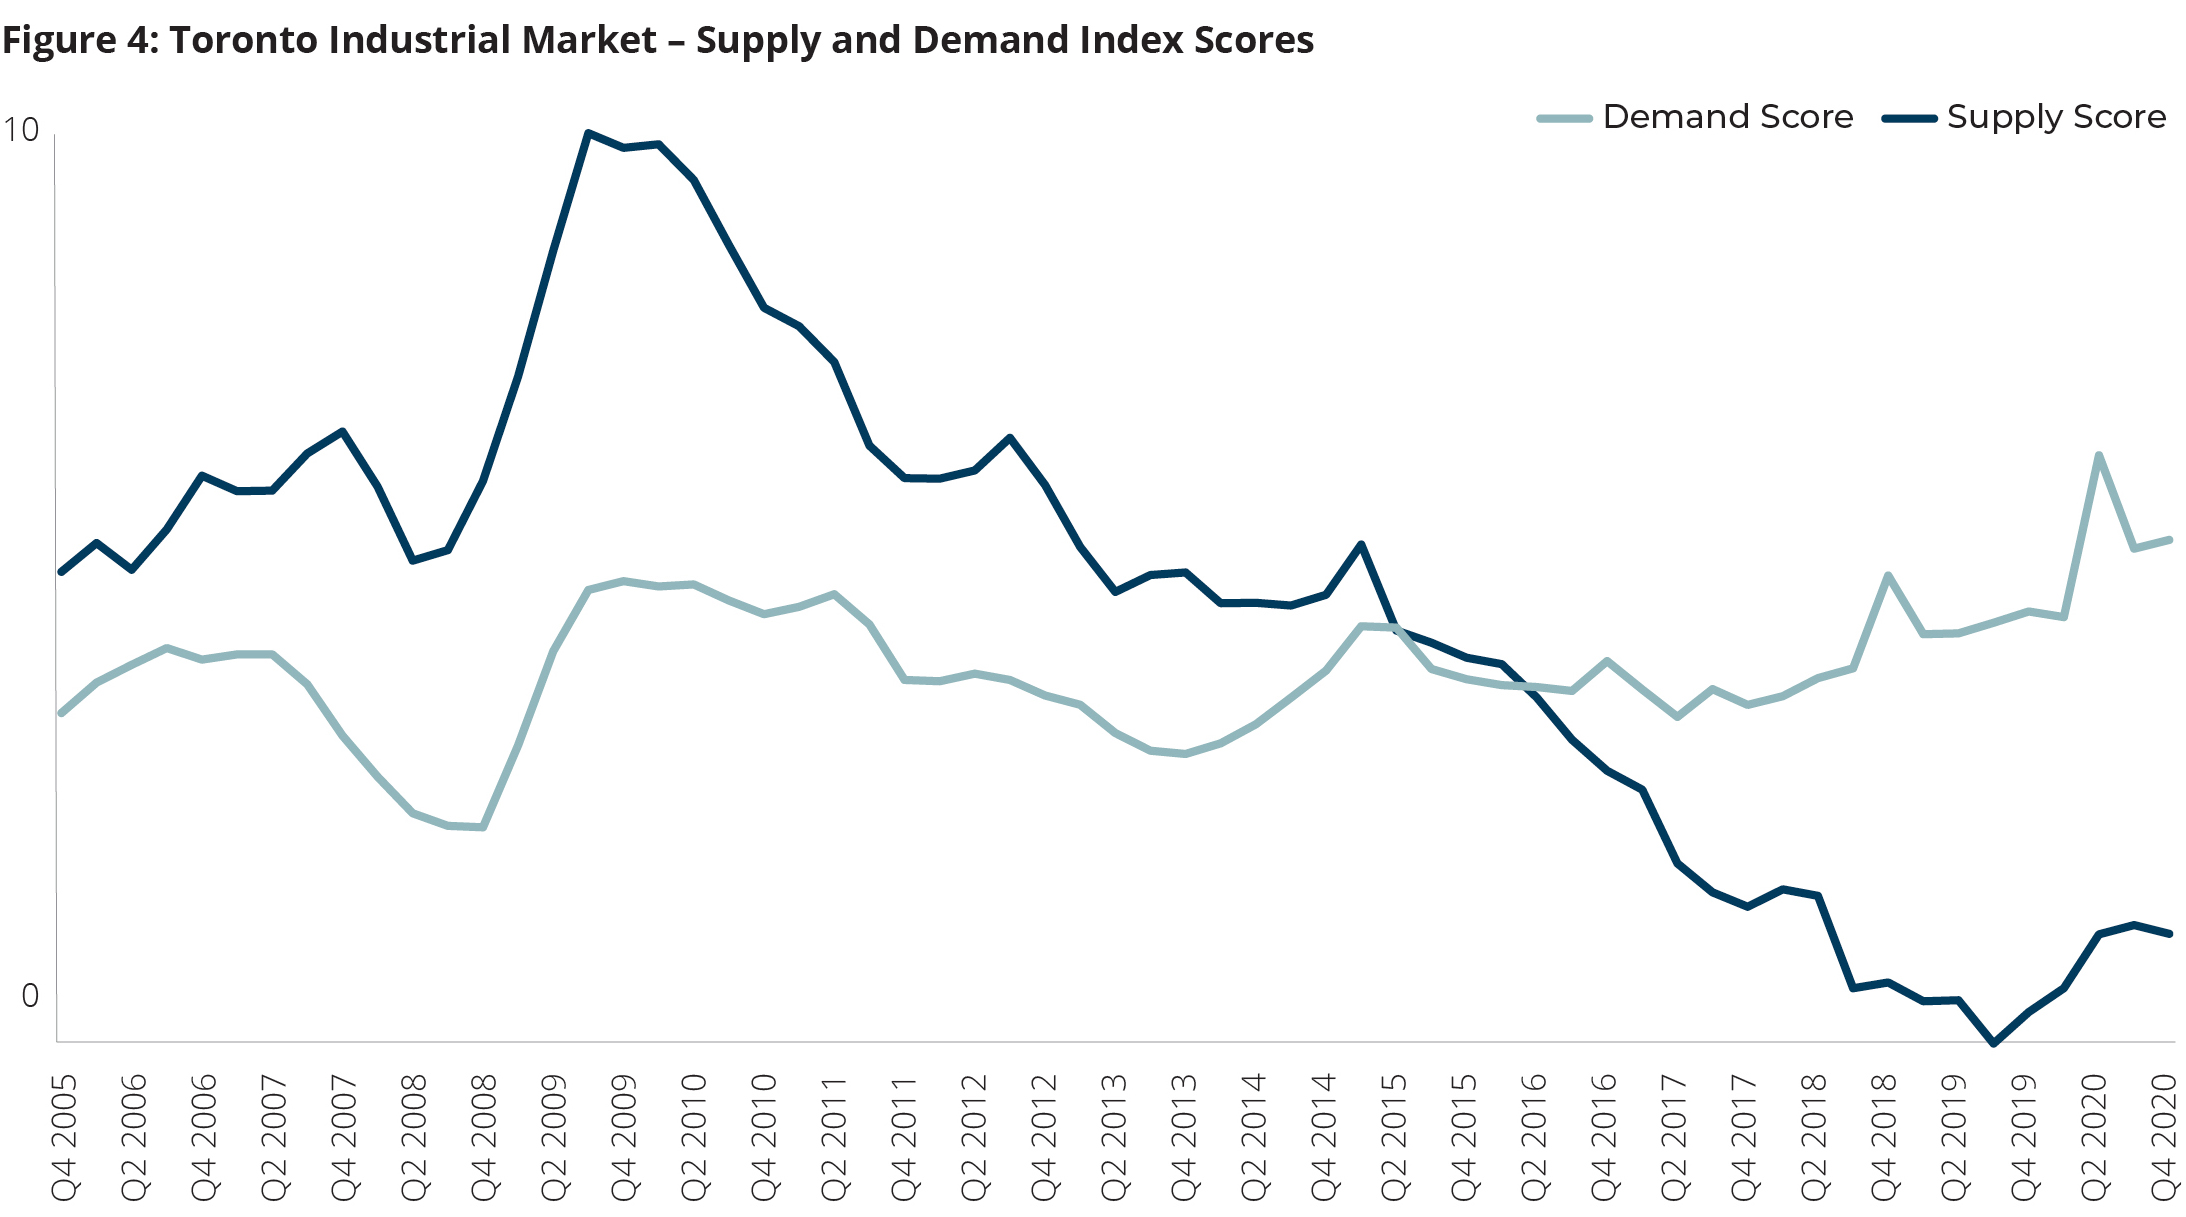
Looking at the demand score, several interesting themes emerge. First is that fact that while the score is trending up in recent years with the structural rise of e-commerce, there still are ‘ups and down’s over that time, which are reflective of cyclical economic factors such as retail sales, manufacturing activity and warehouse inventory levels. These economic factors are more apparent when we look back over the last fifteen years prior and through the Global Financial Crisis. Conversely, when we look at the supply score, which accounts for both current and future expected supply, we can see how rapid the level has dropped since 2015. While there were increases in the supply score in 2020 due to new developments being completed, the current level remains historically low.
If we look at demand over supply more specifically, a link to rent growth emerges. Generally, since 2016, the relative level (or ‘gap’) of demand over supply is significant and has a direct influence on rent growth. Figure 5 shows the net demand-supply score (essentially demand minus supply) for the Toronto industrial market. As noted, a higher score denotes a higher demand-supply imbalance. As for how this translates into rent growth, Figure 6 is a scatter plot that shows Toronto’s overall Index score and annualized rent growth the following 12 months. Lagging the relationship by several quarters shows the predictive aspects of the index approach, which we found best within a 12 to 24 month range.
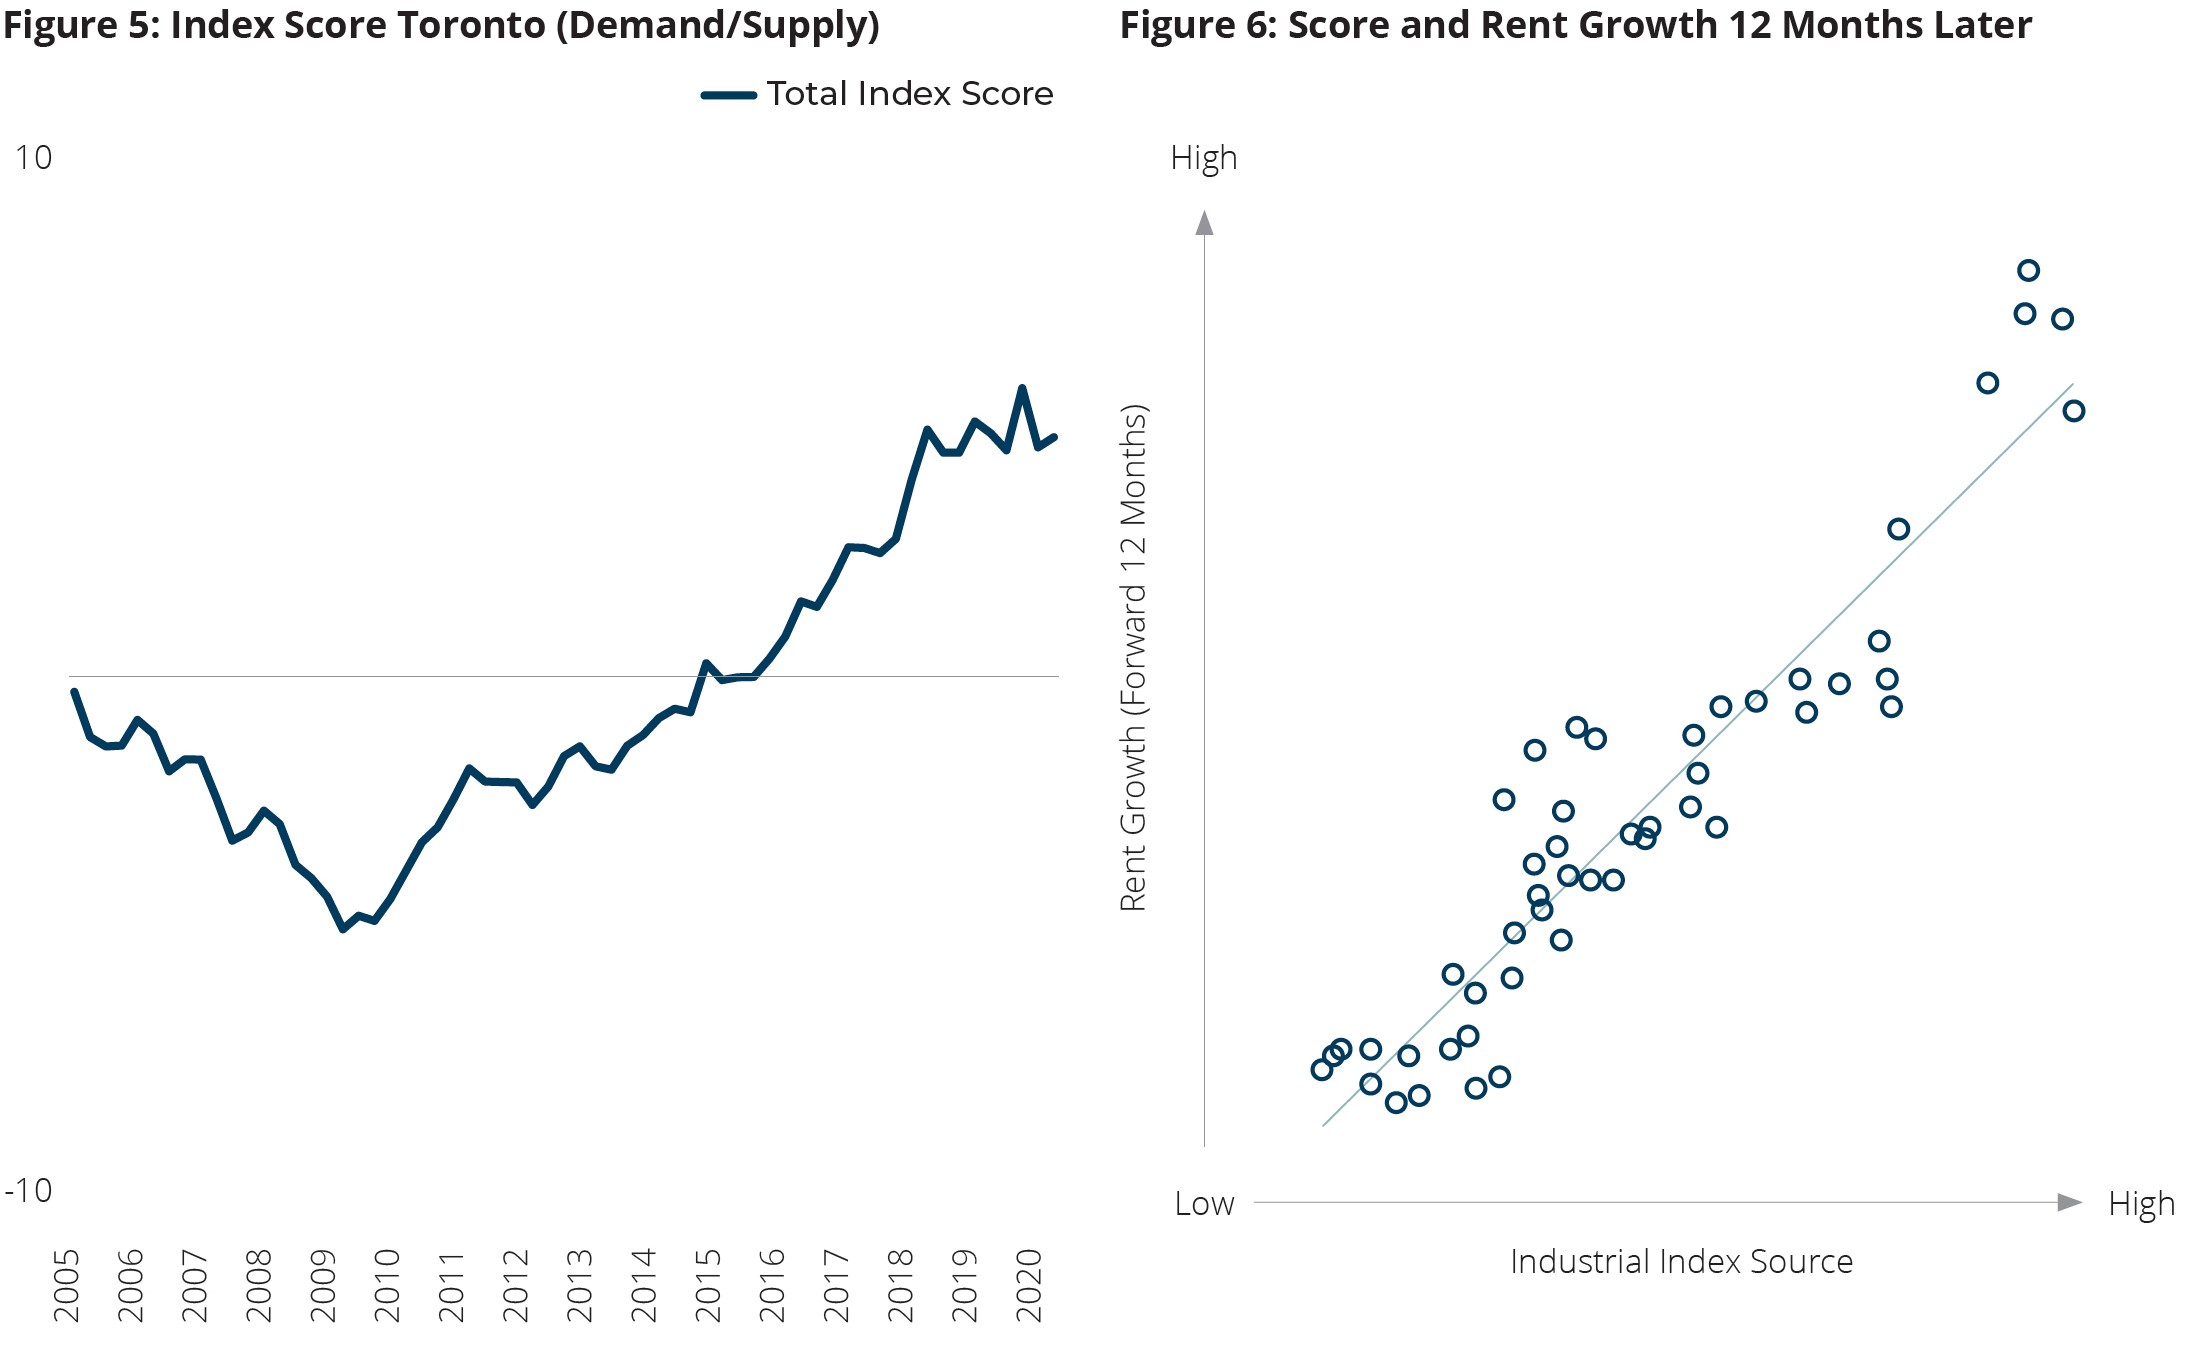
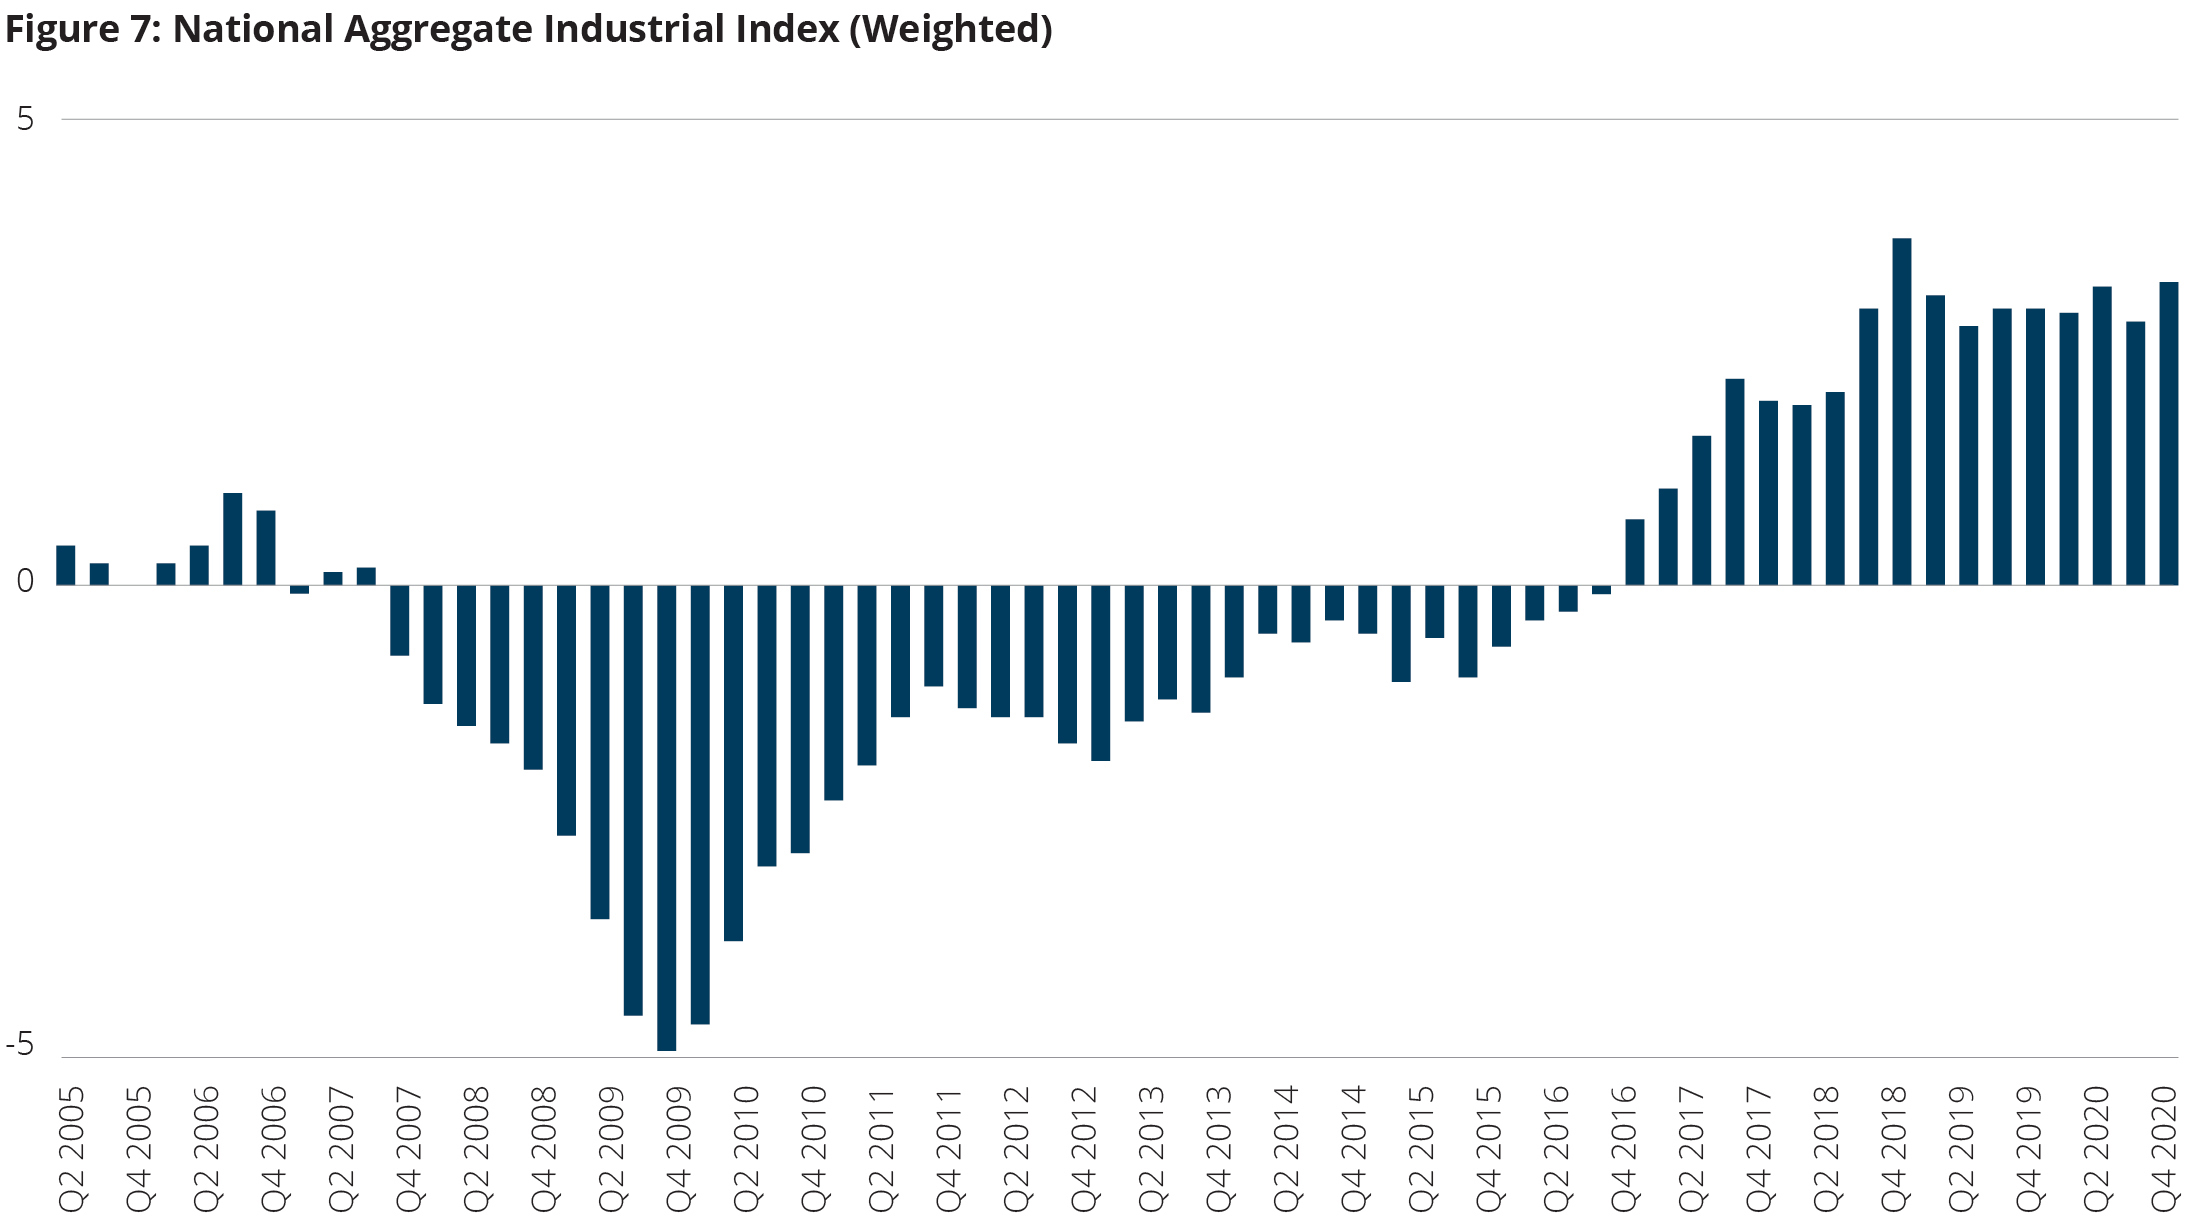
Figure 7 shows the aggregate Index score across the major Canadian markets we track. Generally, the aggregate score continues to show strength in the industrial market (and underlying supply constraints that persist across most markets). Tailwinds from e-commerce and rising product inventories appear to be offsetting sectors negatively impacted by the pandemic, including those with integrated global supply chains or those more sensitive to local economic activity. While this was already evident with the continued growth of e-commerce, the application of our industrial index provides a more quantifiable metric for demand, and one that can be used to better measure change in rent growth over time.
At GWL Realty Advisors, we continue to monitor and update this index as market conditions change.
1 According to Mckinsey, 10 years of e-commerce adoption was compressed into three months due to covid-19.
Mckinsey, (2020). The Quickening. Mckinsey Quarterly.

Based in Vancouver, Anthio brings more than 15 years of experience to GWLRA’s Research and Strategy team specializing in property market analysis, applied research and portfolio strategy. He has a Master’s in Urban Planning and Development from the University of Toronto.