
The Density Factor in Regional Office Demand
For most property investors, understanding the differences between urban and suburban office demand is an important one, especially as urbanization and ‘live-work-play’ environments continue to influence where tenants locate in a market.
Across Canadian cities however, the urban-suburban office dynamic is not the same. Some cities have downtown office nodes that notably outperform their suburban counterparts in terms of demand and achievable rents; other cities tend to be more nuanced.
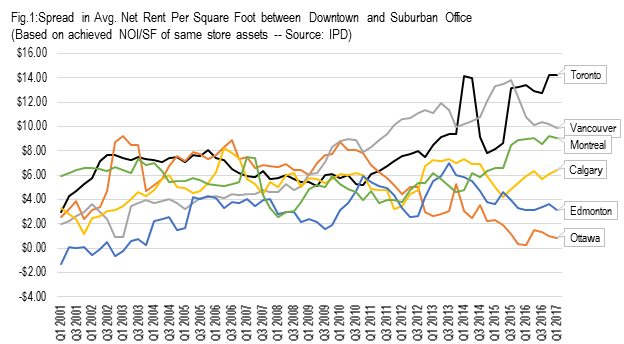
This trend is apparent when we look at the difference in rents between downtown and suburban office across six major markets in Canada. Figure 1, which shows the quarterly ‘gap’ in achieved rents[1] between downtown and suburban areas highlight that in three markets—Toronto, Vancouver and Montreal—rents are much higher downtown, especially since the 2008-2009 financial crisis. The chart further shows that the rental gap between downtown and the suburbs is notably smaller in Calgary, and minimal in Edmonton and Ottawa.
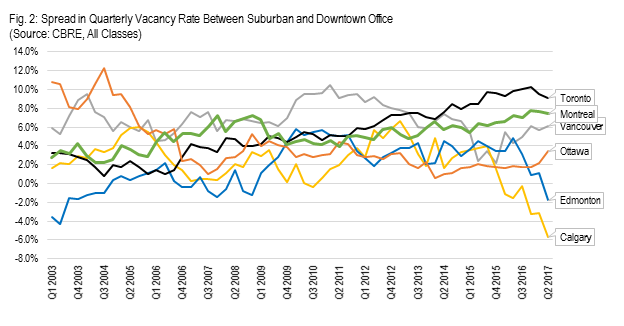
Vacancies have also generally trended the same direction as noted in Figure 2. Notably, Toronto’s downtown vacancy rate is nearly 10% lower than its suburbs, a figure that had been steadily increasing since 2003.
So is new supply to blame for the under performance in some suburban office markets? Not necessarily.
While a recent GWLRA research note highlighted that suburban office markets in Canada witnessed one of the largest new supply waves in recent history from 2012 to 2016, the same development cycle also occurred downtown. In fact, most cities saw close to a 50/50 split between downtown and suburban office development with the exception of Montreal as noted in Figure 3. In Ottawa and Edmonton, where the difference in rent and vacancy is minimal, there was actually more space built in the suburbs.
| Fig. 3: Total New Supply Since 2012 by CMA | Downtown (SF) | Suburban (SF) | Suburban to Downtown Supply Ratio |
| Vancouver | 1.9 million | 2.3 million | 1.2 |
| Calgary | 4.7 million | 4.2 million | 0.9 |
| Edmonton | 1.1 million | 1.4 million | 1.3 |
| Toronto | 5.4 million | 4.0 million | 0.7 |
| Ottawa | 420,000 | 630,000 | 1.5 |
| Montreal | 1 million | 3.3 million | 3.3 |
| Source: CBRE | |||
So are there other factors driving the divergence across Canadian cities?
Density data from Statistics Canada may provide some clues. Looking at the population density of the 15 largest census metropolitan regions across Canada in Figure 4, we see that Toronto, Montreal and Vancouver have densities that are significantly higher than the rest of Canada. The gap between Vancouver and Hamilton notably—third and fourth respectively in terms of density—is nearly 300 persons per square kilometre. Calgary, Ottawa and Edmonton are 10th, 12th and 15th on the list respectively, despite Calgary and Edmonton both increasing their densities by over 10% since 2011.
| Fig. 4: Population Density, Top 15 Canadian CMAs (Source: Statistics Canada) | 2011 Population Density (PP/SQ.KM) | 2016 Population Density (PP/SQ.KM) | 2011 to 2016 Density Change (%) | Population, 2016 | 2016 Density Rank |
| Toronto | 945 | 1,004 | 6.2% | 5,928,040 | 1 |
| Montréal | 898 | 890 | -0.9% | 4,098,927 | 2 |
| Vancouver | 802 | 855 | 6.6% | 2,463,431 | 3 |
| Hamilton | 525 | 545 | 3.8% | 747,545 | 4 |
| Victoria | 495 | 528 | 6.7% | 367,770 | 5 |
| Kitchener-Waterloo | 576 | 480 | -16.6% | 523,894 | 6 |
| Oshawa | 394 | 420 | 6.7% | 379,848 | 7 |
| Windsor | 312 | 322 | 3.2% | 329,144 | 8 |
| St. Catharines-Niagara | 280 | 291 | 3.8% | 406,074 | 9 |
| Calgary | 237 | 273 | 15.0% | 1,392,609 | 10 |
| Québec | 228 | 235 | 3.0% | 800,296 | 11 |
| Ottawa-Gatineau | 196 | 196 | -0.2% | 1,323,783 | 12 |
| London | 178 | 186 | 4.3% | 494,069 | 13 |
| Winnipeg | 137 | 147 | 7.1% | 778,489 | 14 |
| Edmonton | 123 | 140 | 13.8% | 1,321,426 | 15 |
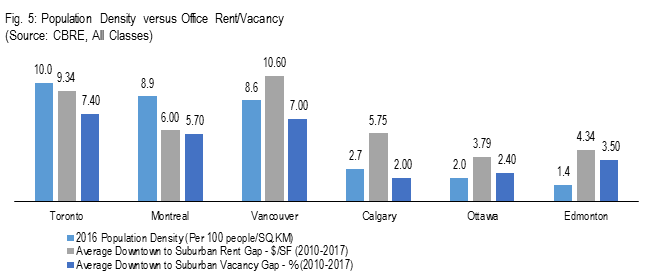
While the definition of regional boundaries play a factor in calculating overall population density, the data from Statistics Canada seems to align fairly well with the office rental and vacancy trends we are seeing, especially since 2010. Figure 5 highlights this relationship.
So what are the implications for investors?
The findings suggest that cities with higher densities tend to have stronger downtown office demand relative to their suburbs. If we look at Vancouver, Toronto and Montreal, their downtown areas are increasingly attractive places to work, supported by a mix of uses and an abundance of amenities. For cities that are less dense, this does not mean that downtown office demand is not strong; it merely highlights that office performance is more balanced regionally. Downtown environments in lower density cities tend to be less mixed and traffic congestion is also lower, making regional commuting easier.
Ultimately, understanding the depth, scale and also quality of urbanization is important when trying to analyze office demand patterns within a city. No two cities are alike from an office perspective, and neither are their urban forms.
[1] Achieved rents defined as the overall current Net Operating Income per Square Foot of office buildings tracked within the MSCI/IPD property index.

Based in Vancouver, Anthio brings more than 15 years of experience to GWLRA’s Research and Strategy team specializing in property market analysis, applied research and portfolio strategy. He has a Master’s in Urban Planning and Development from the University of Toronto.