
Understanding Real Estate Performance through Sortino Ratios
Understanding risk is important for any investor. For real estate, this applies not only to the performance of a single building but an entire property portfolio as well.
When investors talk about measuring the riskiness of an investment, many typically refer to the Sharpe Ratio.
For those not familiar with the Sharpe Ratio, it is found by dividing the average period return of an investment by the standard deviation of those returns. The higher the ratio, the higher the return over the standard deviation—suggesting the overall return of the investment generally outweighs the “ups and downs” associated with holding it. Because the general notion that significant ups and downs for an investment over time signals volatility and therefore more risk, higher Sharpe Ratios suggest better risk-adjusted returns than similar assets with lower Sharpe Ratios.
Figure 1: General Equation for the Sharpe Ratio
Sharpe Ratio = Average Period Return/Standard Deviation of Returns
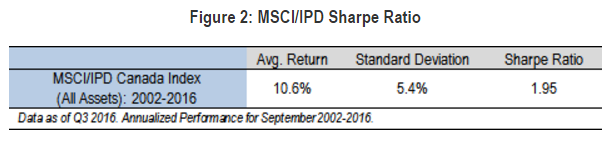
Though typically reserved for equities and bond markets, Sharpe Ratios can also be used to measure the risk-adjusted performance of real estate and property portfolios. One real estate application of the Sharpe Ratio is the MSCI/IPD Index, which tracks the investment performance for over 2,000 directly-held commercial properties across Canada. Figure 2 below highlights that the Index has yielded a Sharpe Ratio of 1.95 the last 10 years.
A limitation of Sharpe Ratios however, is that it treats both upward volatility and downward volatility the same—that is, negative return movements are treated the same as positive return movements. But what if an investor was more concerned about minimizing risk than achieving outsized performance?
The Sortino Ratio accordingly, is a modified version of the Sharpe Ratio that only looks at average returns relative to negative returns. The rationale for measuring negative returns only is so that an investment is not penalized for being volatile if it is to the upside. Sortino Ratios are only concerned about downside risk (e.g. the frequency and size of negative returns).
Figure 3: General equation of the Sortino Ratio1
Sortino Ratio = Average Period Return/Standard Deviation of Negative Returns
It is important to highlight that many investors subtract a “risk-free” rate from investment returns before calculating a Sharpe or Sortino Ratio. This risk-free rate is usually an investor’s hurdle rate or risk premium for investing in the asset. The rationale for the subtraction is to account for an investor’s minimum return expectations. For instance, investors commonly use the 10 year Government of Canada Bond Yield or CPI as the risk-free rate of return and judge other investments accordingly. This approach is similar to comparing capitalization rates with bond yields to understand the relative spread in returns.
Using MSCI/IPD data, we can compare the Sharpe and Sortino Ratios of Toronto and Vancouver multifamily properties over the last 10 years in Figure 4 below.
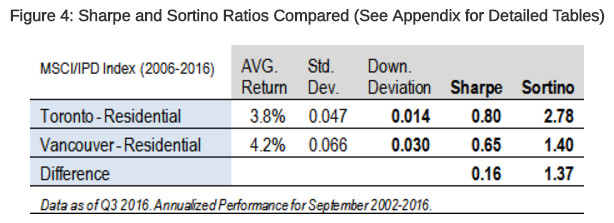
After subtracting the risk-free rate from the returns2, Toronto and Vancouver both have similar Sharpe Ratios: Toronto is 0.80, and Vancouver is 0.65. Applying Sortino Ratios to the data however, shows a different story: because Toronto has had stable returns but also less negative returns, its downside deviation is less than Vancouver’s. Toronto’s Sortino ratio accordingly is 2.78, compared to 1.40 for Vancouver. Sortino Ratios would suggest Toronto is as stronger market if one was looking at downside risk. Conversely, if an investor was focused on total growth only, both would be compelling investments as they offer similar average returns. Judging which is better – higher total returns or minimal volatility – depends on the investor and their objectives.
[1] This report from Red Rock Capital provides a good overview of Sortino Ratio calculations and methodology.
[2] The 10 year bond yield or CPI, plus a basis point premium, is a common risk-free rate used in real estate. In our example, The 10 year bond yield 400 Bps is the risk free rate for the analysis refers to the historical spread between real estate capitalization rates and bond yields.

Based in Vancouver, Anthio brings more than 15 years of experience to GWLRA’s Research and Strategy team specializing in property market analysis, applied research and portfolio strategy. He has a Master’s in Urban Planning and Development from the University of Toronto.