
Vaulting Office Demand to new Heights: 2020 Perspective on the 2010 Vancouver Olympic Winter Games
In 2003, as Research Director at Avison Young, Wendy Waters (now Vice President, Research Services & Strategy at GWL Realty Advisors) analyzed the potential impact the 2010 Olympics could have in reinventing Vancouver’s economy and office market.1
This was prior to Vancouver being awarded the games. Below she summarizes that past research and assesses the accuracy of the forecast made 17 years ago for the longer-term impacts of hosting the Olympics on Vancouver’s office market. GWLRA would like to thank Avison Young for providing office market data for this report.
The Context
When the Vancouver Olympic Bid Corporation submitted its formal application in 2002 to host the 2010 Olympic Winter Games, Vancouver’s office vacancy had reached 15%. The forestry sector had been shedding office jobs for several years as global firms bought British Columbian companies and relocated head quarters outside of Canada. Mining was not doing much better. And the emerging technology sector which had looked promising in 2000, had largely collapsed when the dot com bubble burst in 2001 leaving vacant office space in its wake. Vancouver needed a transformative experience to change this trajectory.

Avison Young Olympic Impact Forecast
The 2003 Avison Young report, Olympics and Beyond: Implications for Greater Vancouver’s Office Market, revealed that, in addition to the direct office needs to organize and host the games, Vancouver had the potential to attract as many as 100 companies and thousands of jobs from companies unrelated to the Olympics. This conclusion was based on the actual experiences of past Olympic host cities. Most Olympic Games have an attached economic development component in which business and political leaders use the added publicity of the games to showcase their region and its workforce to the world. The Vancouver Economic Development Corporation had such a plan.
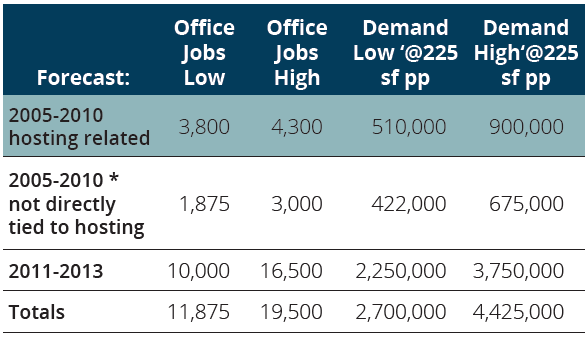
Based on successes for other host cities, The Avison Young report forecast that Vancouver could experience an additional 1,875-3,000 new office-based jobs between 2005 and 2010, and a further 3,000-6,000 per year in 2011-2013, the years following the games. This would amount to between 2.4 Million and 4.7 million square feet of office demand, at the prevailing average ratio of office space to employee of 225 square feet (which has since declined substantially to approximately 175 square feet). This would be beyond organic growth that may have been possible without the Games.

Estimating the Actual Olympic Impact in Vancouver
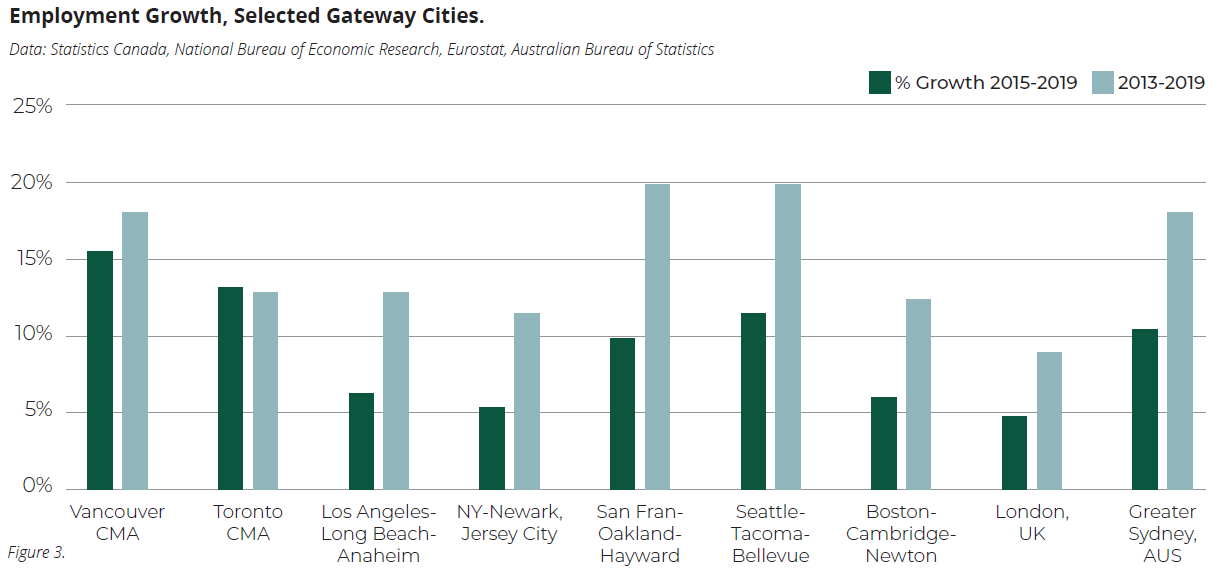
The Vancouver region has experienced strong employment growth since 2010. The metropolitan area has matched or outpaced the growth of many other global gateway centres including Sydney, Toronto, Seattle, San Francisco, New York, and Boston. (See figure 4). While some of this growth would have happened without the Games, there is a compelling case that hosting the Olympics indeed catalyzed employment expansion, attracting many new employers and allowing local companies—such as Lululemon, Electronic Arts and Hootsuite as well as condominium and other real estate specialists—a bigger stage onto which they could showcase their products or services, and export them to the world.
Demand directly and indirectly related to hosting the Olympics prior to 2010 was underestimated (and the author takes responsibility for this). The engineering and construction employment to build or upgrade infrastructure generated significant demand. Projects including the Canada Line, the Sea-to-Sky Highway upgrade, and constructing new, or renovating existing, ice rinks and other sports facilities supported both direct jobs and indirect employment (such as legal and accounting work).
When the financial crisis hit in 2008-2009, much of the infrastructure work was winding down and project offices closed. This contributed to the negative absorption in that year, as did layoffs more directly tied to the financial crisis.

From 2000 to 2004, Vancouver’s annual office absorption averaged 100,000 square feet. From 2005-2008 the annual average was over 1,000,000 square feet. This suggests that hosting the Olympics accelerated office demand prior to the games. While some of this absorption boost was connected directly to hosting the games, other growth was from companies entering or expanding in the market in response to the enhanced profile Vancouver received in these years leading up to the games.2 A natural recovery from the 2000-2001 dot com bust also likely played a role.
The year 2010
As documented in the 2003 Avison Young report, all host cities experience an “Olympic Hangover.” This phenomenon happens in the months following the games when the staff (and their families) who moved to the city to help stage or broadcast the games depart for the next one. In 2010 this was approximately 2000 people. This departure also caused a decline in sales for businesses who sold goods or services to the organizers. For Vancouver and BC, the global financial crisis and lower demand for natural resources such as lumber added to the drag on growth after the games ended in March 2010.
Beyond 2010
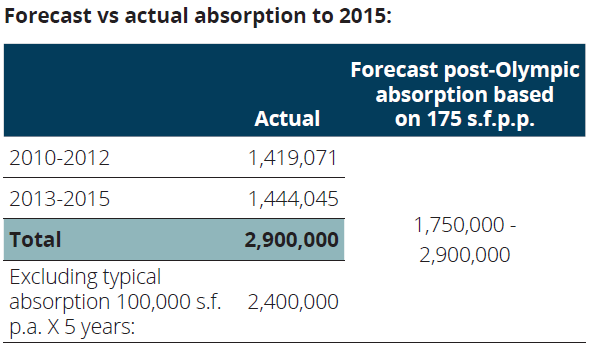
For 2010-2012, total absorption was 1,419,000 square feet or nearly 500,000 square feet per year. This was well above the average prior to Vancouver being awarded the games of 100,000 square feet. And all of this was in spite of the global financial crisis and Olympic Hangover.
The Global Financial Crisis hit US firms particularly hard and resulted in many American companies’ expansion plans being postponed. Because of the slowed global economy in 2011-2012, a portion of the additional 1.4 M s.f. of office absorption in Metro Vancouver from 2013 to 2015 could also be considered part of the Olympic-generated growth spurt.
Therefore, from a total absorption from 2010-2015 of 2.9 Million square feet, if we subtract 500,000 square feet (or 100,000 square feet per year, the pre-Olympic average), this leaves 2.4 million square feet of absorption that could be attributed—at least partially--to hosting the Olympics and the showcasing of Vancouver as a great place to live, work and have a branch business operation.
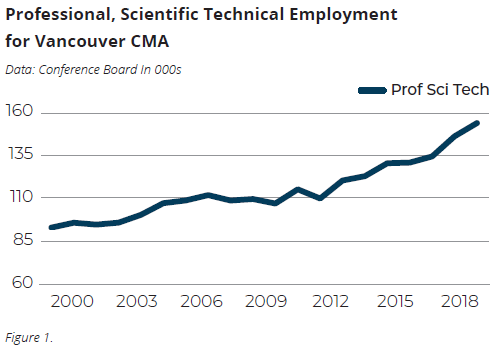
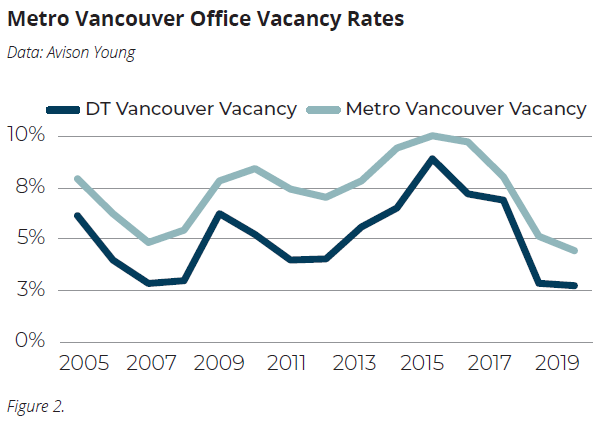
Because office vacancy was low during this time (see figure 2), it is also possible that some companies who would have opened operations in Vancouver, did not do so; the office space they needed was not available. We also know that some office tenants absorbed space not in office buildings—instead ending up in the mezzanines of residential towers or in old or flex industrial space. This absorption was not tracked by Avison Young nor the other brokerage houses, yet it still represented a further growth in employment and demand for office space in the region. For example, Figure 1 shows the sharp growth in professional, scientific, and technical employment post 2010—a key office-using sector. This includes many technology sector jobs, engineering roles, as well as legal, accounting and consulting.
Forecast Assessed
Because the global financial crisis of 2009-2011 delayed corporate expansion around the world, it is especially challenging to separate employment generated by Olympic-related exposure from that which may have occurred anyway. The evidence nevertheless suggests the Olympics had a strong impact. The forecast from 2003 proved reasonably accurate, especially if we switch the square-foot-per job-ratio from 225 square feet (typical in 2002) to 175 square feet (more typical by 2015). At that lower ratio, the forecast would have been 1,750,000-2,900,000 square feet of absorption. And indeed, it appears the Olympic impact could have been as much as 2,400,000 square feet.
Comparing Vancouver to other global cities
The Olympics helped solidify Vancouver’s place in the minds of many political and business leaders as a global city. When real estate investors and corporate leaders talk about the Global Gateway Cities and technology centres Vancouver is usually among them—despite being much smaller than the other locales usually on these lists (San Francisco, Seattle, New York, Sydney, London or Toronto), and having fewer major head offices.3
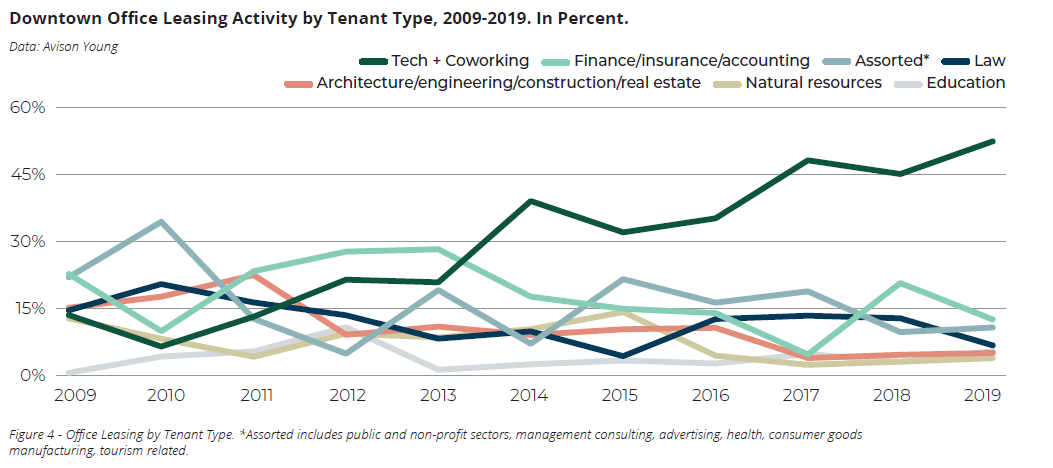
These and other cities with quality technology clusters have seen strong employment gains over the past decade, and specially the past few years. See Figures 3 and 4.
Among global gateway cities outside of China, Vancouver has kept pace in terms of employment growth since 2010. See Figure 3. Since 2015, Vancouver has outpaced the others. How much can be attributed to the Olympic Games is impossible to measure. Yet evidence above suggests the Olympics were a key catalyst in remaking Vancouver into a knowledge-economy, gateway city.
Appendix: Detailed explanations of challenges assessing the Olympic impact. Several unforeseen events impacted the accuracy of the forecast:
First, the Global Financial Crisis hit in 2008-2009. This led many global companies to stop their expansion plans, especially those based in the hardest-hit USA. For example, Microsoft closed their Richmond BC facility to reduce costs and because they could replace those BC-based workers with Americans laid off during the crisis. It took until 2012-2013 before companies were again pursuing expansion plans. Therefore, the forecast for Olympic-related 2011-2013 growth should be interpreted with a lag. The impact took longer.
Second, office space usage patterns changed. Companies started using fewer square feet per person. At first, this was often to reduce costs. Soon, the rise of the technology sector, and the expansion of technology roles into all variety of companies supported the use of open, collaborative spaces rather than private offices. This also happened to reduce the square footage per person. As a result, the industry standard has shrunk from 225 square feet per person to about 175. In 2002, 225 square feet was the assumption for calculating office absorption, rather than 175. In this report we switched to the ratio of 175 square feet to provide a more accurate assessment based on job growth.
Third, Vancouver ran out of larger blocks of downtown office space. Vacancy fell to 3.9% in 2011 and 2012. This made it difficult for companies to open offices in Vancouver. Or, if they did, as with Facebook in 2013, they had to choose office space in non-office buildings, which is not tracked in the office statistics so does not appear in the absorption numbers. There cannot be a measurement of demand (absorption) without a supply of office space. For this reason, and because of the lag created by the financial crisis, we believe the Olympic Impact should be measured through 2015, when more space became available.
Fourth, the 1990s create a challenging baseline for Vancouver. In the 1990s, the region welcomed over 100,000 new residents from Hong Kong in the decade prior to the 1997 handover of Hong Kong to China by the United Kingdom. As this was in addition to the typical flow of immigration, it boost the region’s typical population growth to 3.5% for several years. It has since (and prior) averaged closer to 1.5%. Therefore, any comparisons to that time for both population and employment growth (which is closely related) are challenging.
[1] Avison Young, Olympics and Beyond: Implications for Greater Vancouver’s Office Market. July 2003.
[2] For example, see Vancouver as a City Region in the Global Economy: A paper by the Vancouver Economic Development Commission for the Business Council of BC’s “Outlook 2020” project, March 2010. Esp. pp. 10, 33.
[3] See www.wsp-futurecities.com/#rankings for 2018 Global Gateway City rankings in which Vancouver is 5th. Also see CBRE, Global Gateway Cities November 2016.

Leading the national Research and Strategy team, Wendy’s responsibilities include providing economic, demographic and market-trends analysis to support long-term asset acquisition, development and management strategies. Wendy has been working in real estate research since 2002, including over a decade with GWL Realty Advisors. She holds a Ph.D. in comparative-world and economic history from the University of Arizona.