
Yielding Perspective: Cap Rates, Discount Rates and Relative Value for Real Estate
Cap rates are only a proxy for pricing in real estate – what drives underlying property value is more complex
With yields on Government of Canada 10-year Bonds trending between 1.1% and 1.75% the past 12 months, direct real estate remains attractive relative to fixed-income investments. The average all property cap rate reported by the MSCI/REALpac Canada Direct Property Index (MSCI) was 4.9% as of the third quarter of 2019, representing a spread of more than 350bps over the ten-year bond yield.
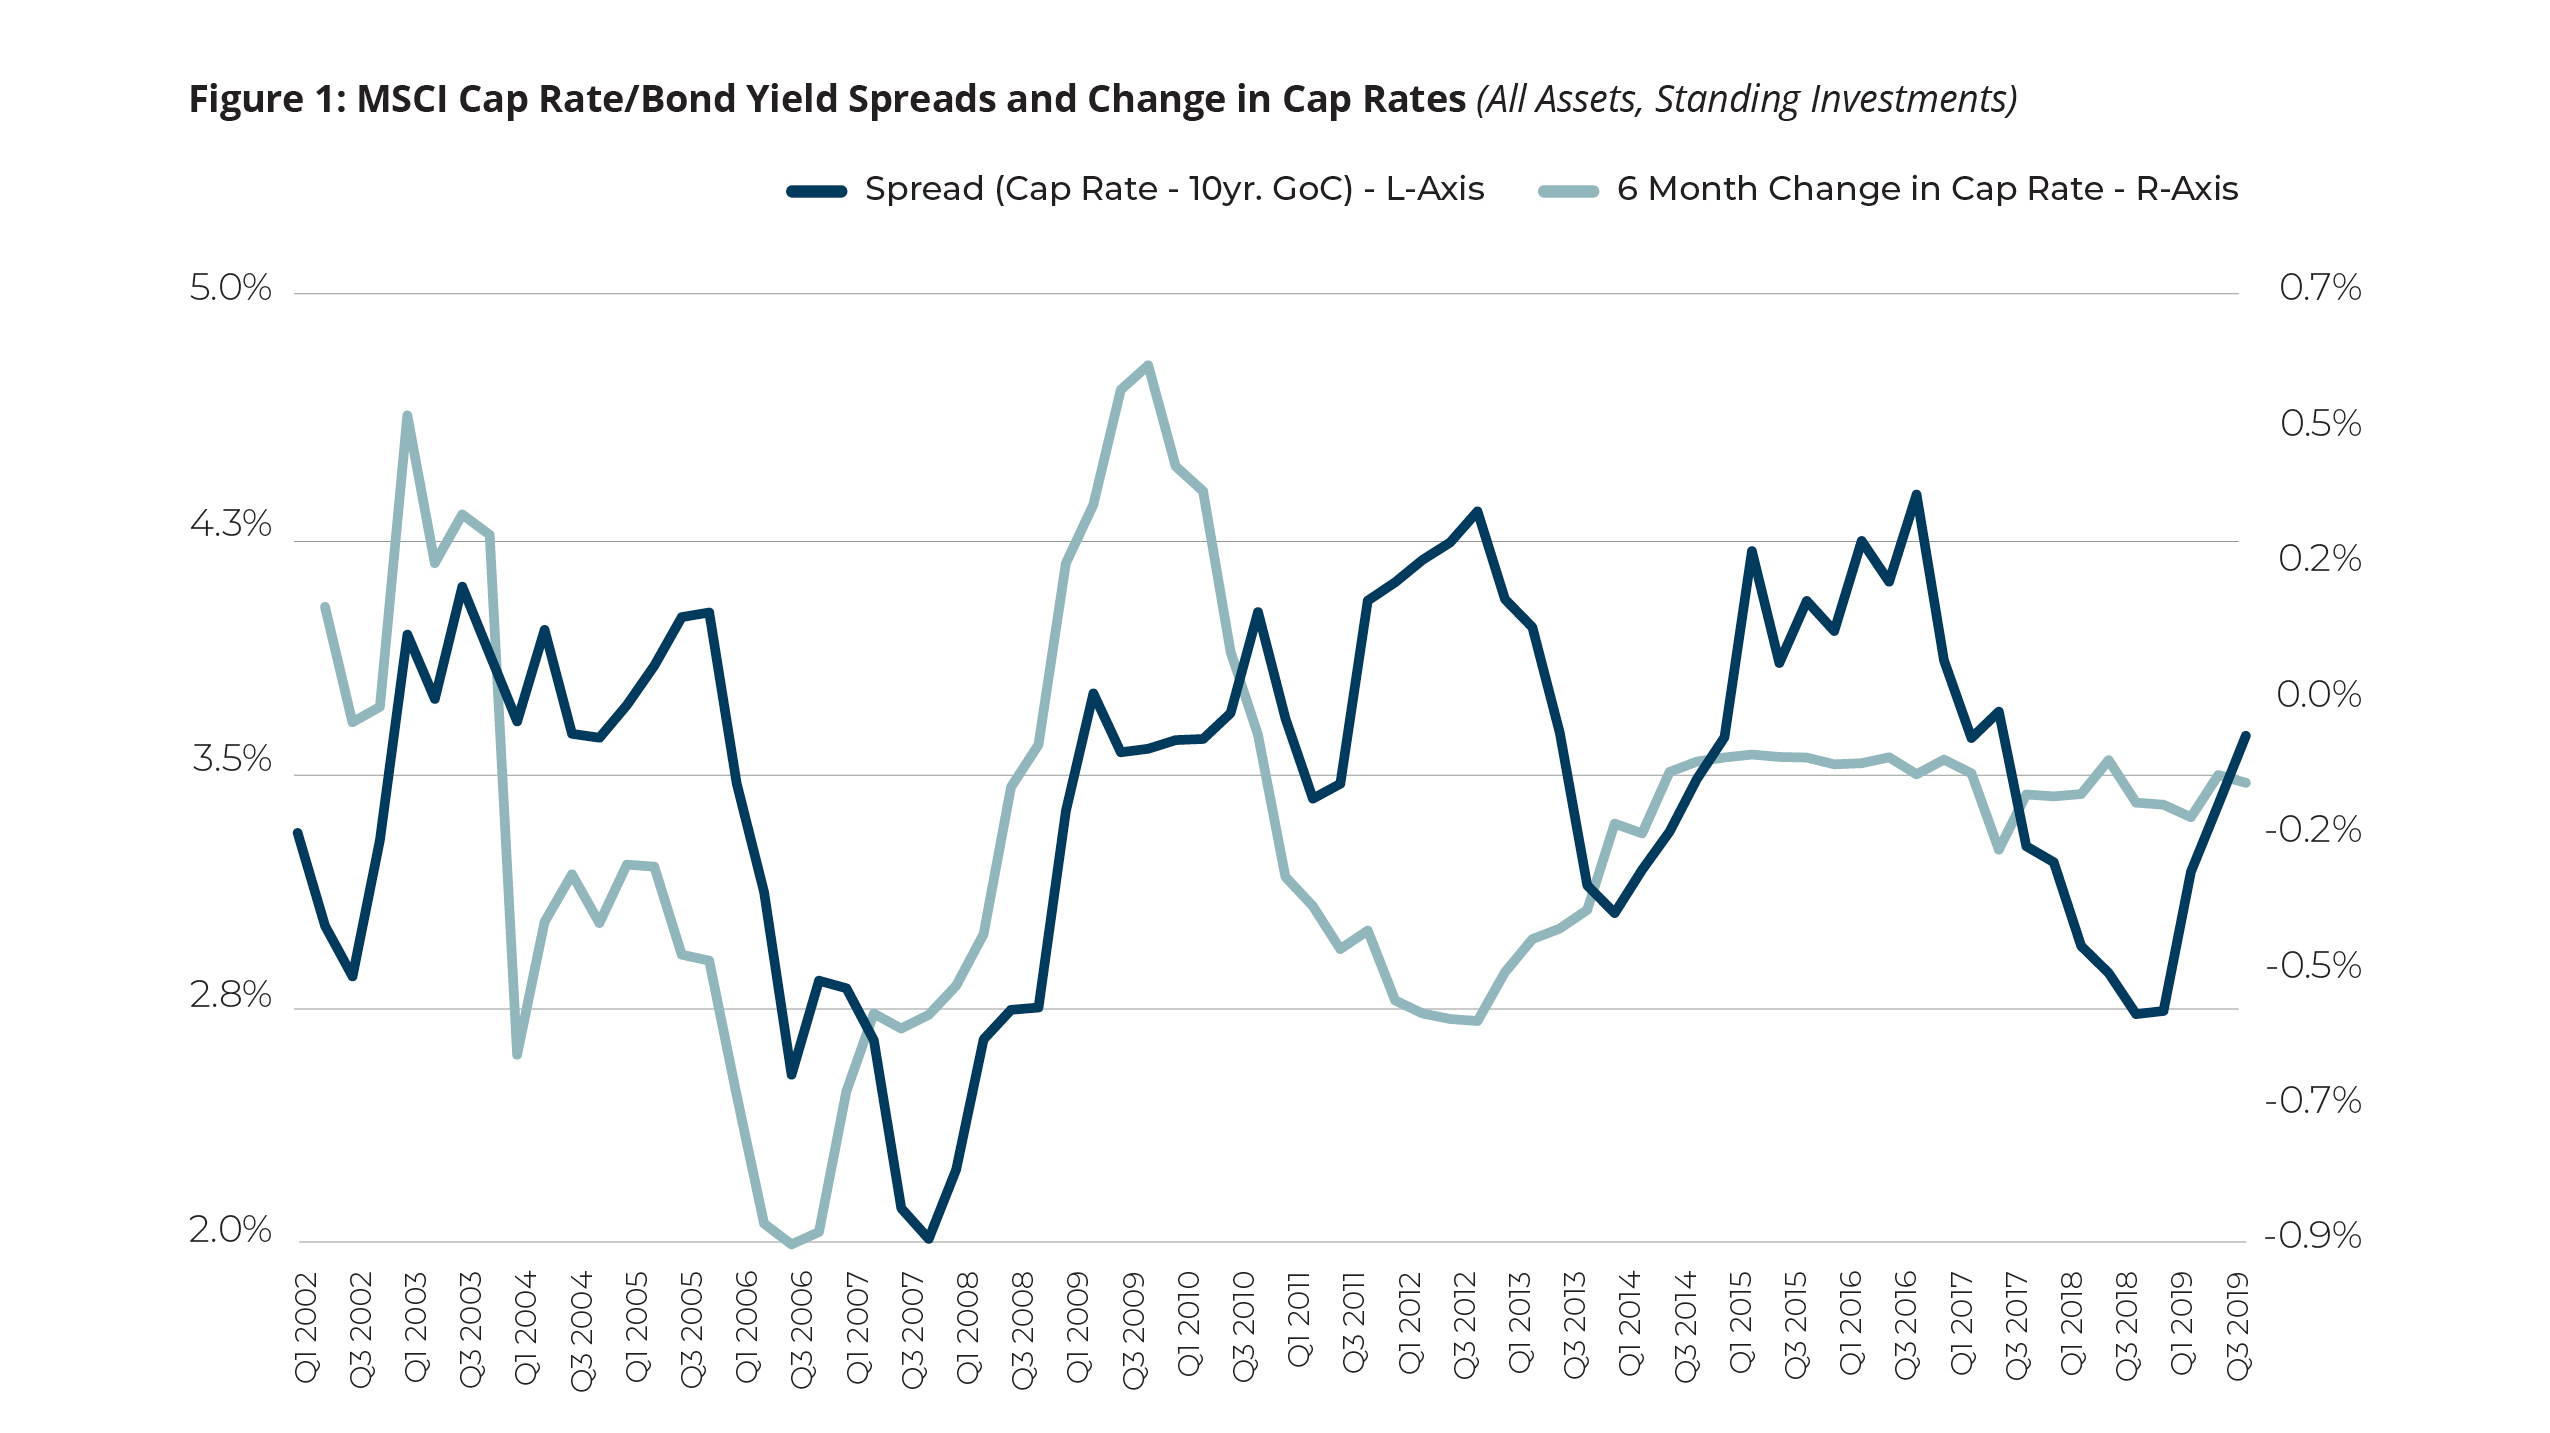
An adage is that the spread between cap rates and risk-free rates (as represented by Government of Canada bonds) is a good indicator for the relative pricing of real estate. When the spread declines, the risk premium required to invest in real estate has narrowed or disappeared—suggesting potential peaking of real estate values. A wide spread conversely, indicates attractive pricing for real estate given the higher yields offered1.
Although the spread is a useful proxy for property values, it is exactly that: a proxy. Despite the link between cap rates, bond yields and real estate values, the relationship is not necessarily causal. While the cap rate-bond yield spread tends to indicate capacity for cap rate compression, it does not necessarily indicate trajectory. Figure 1 highlights this dynamic – narrow spreads tend to highlight slowing cap rate compression but little in the way of velocity. This is especially evident the past decade2.
As we will highlight in this Research Note, there are other, less emphasized factors that influence that spread—notably income growth and discount rates—that are critical determinants of where real estate values are headed.
A Primer on Valuation
Property investors typically derive asset value using a discounted cashflow (DCF) approach where future cashflow (income) is used to determine current value. Key to a DCF valuation is expected income growth, in the form of rents, as well as the discount rate.
With respect to this DCF framework, the relationship between discount rates and cap rates is important. Generally, the higher the spread between discount rates and cap rates, the higher the income growth required to justify current property values. Conversely, the lower the spread, the lower the income growth required. The determination of discount rates varies by investor but the cost of debt, capital structure and perceived risk are all influences. Among institutional investors such as Pension Funds and Insurance Companies, discount rates are typically based on their required liabilities and future funding levels. As a result of these liabilities and capital requirements, discount rates can only decline so far relative to cap rates3.
How investors think rents will grow accordingly, is a key to pricing and direction of future value.
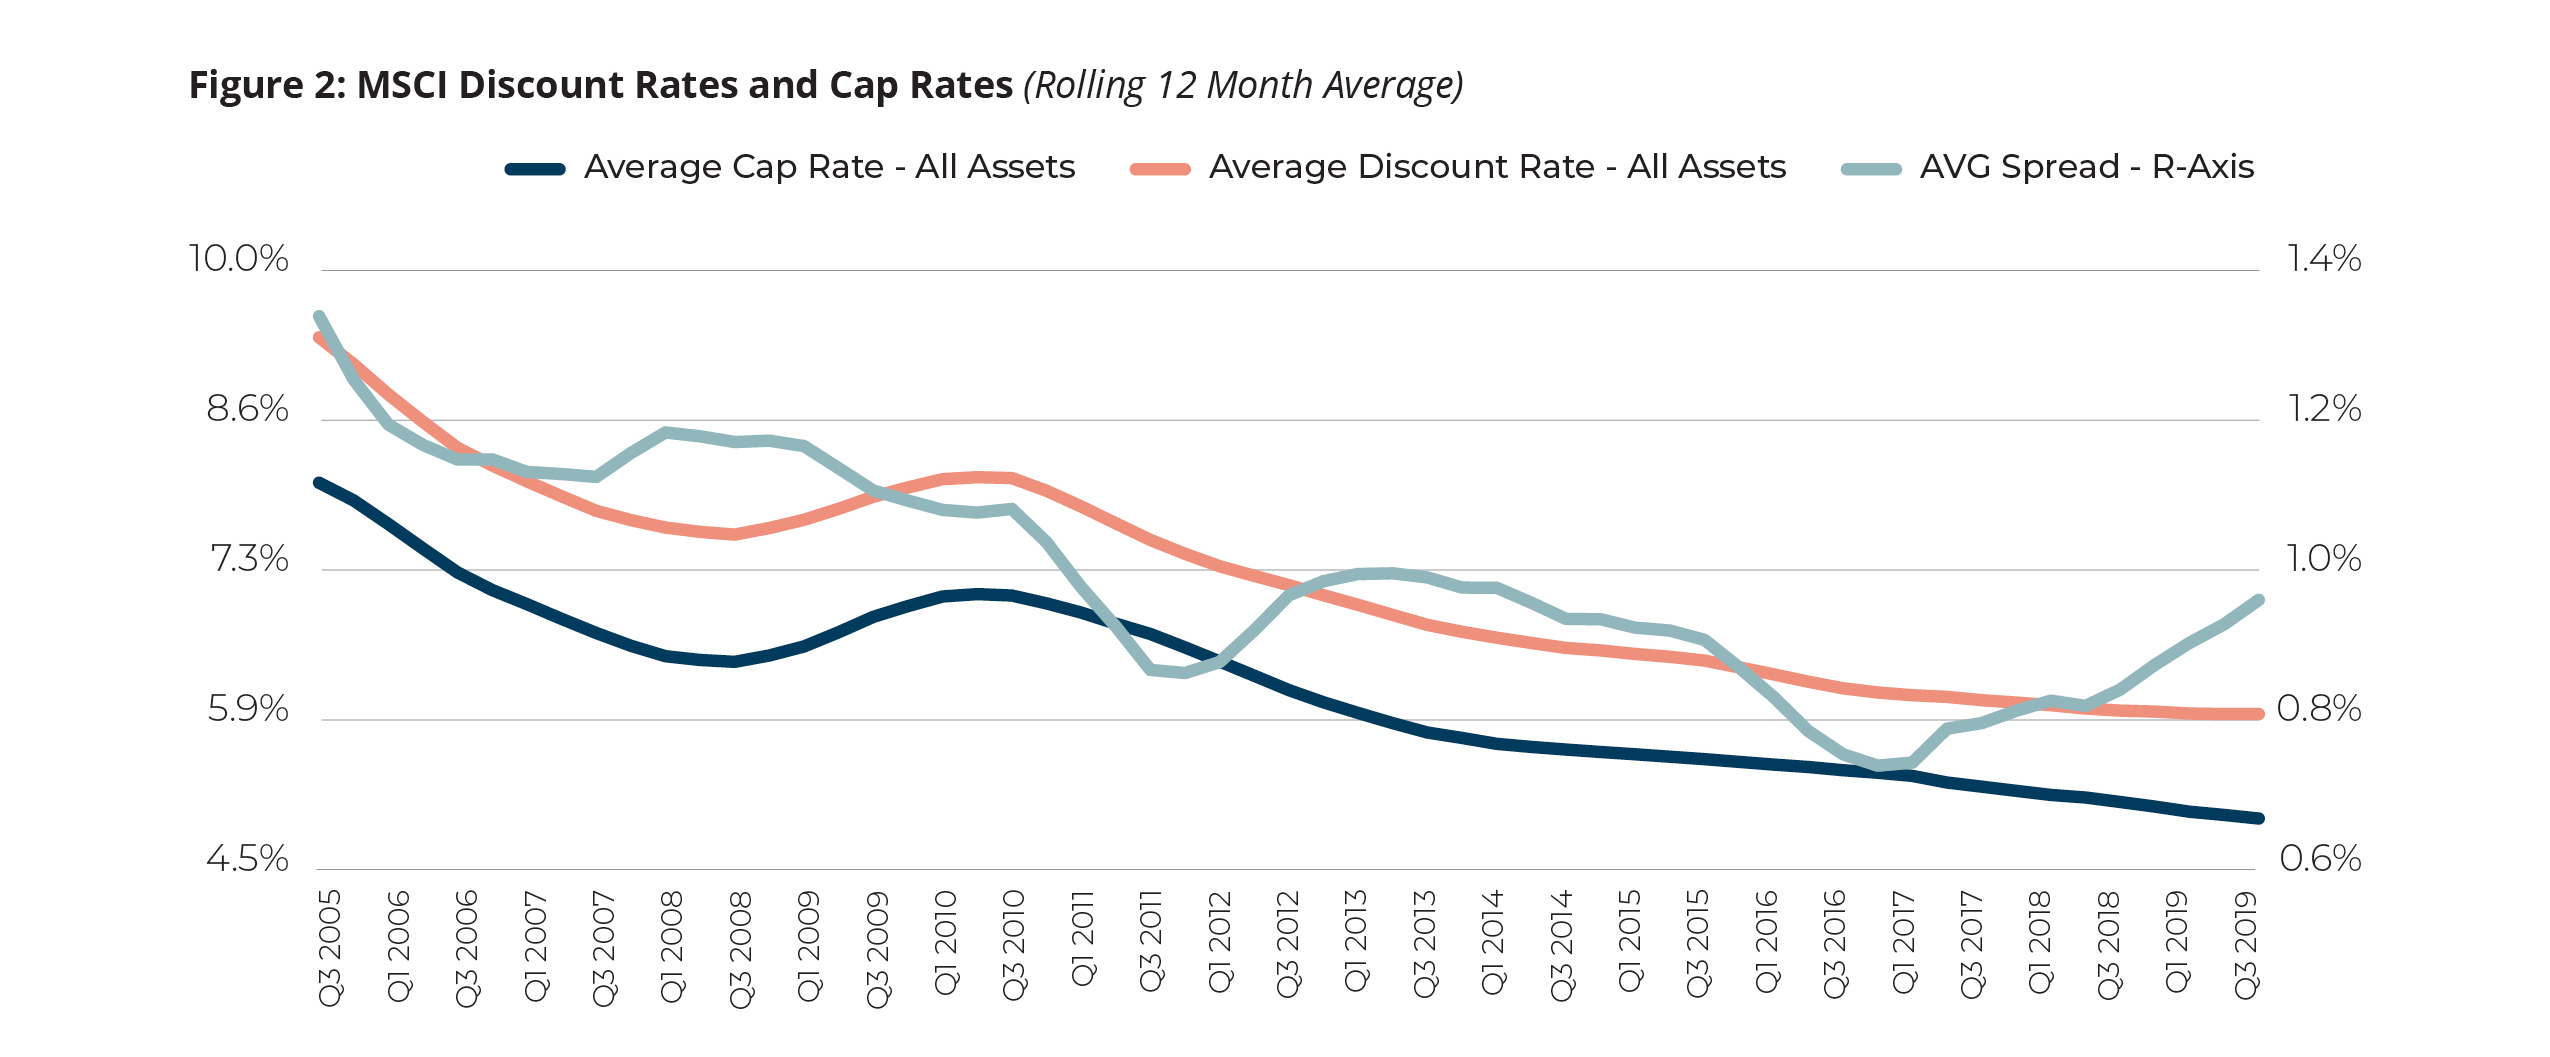
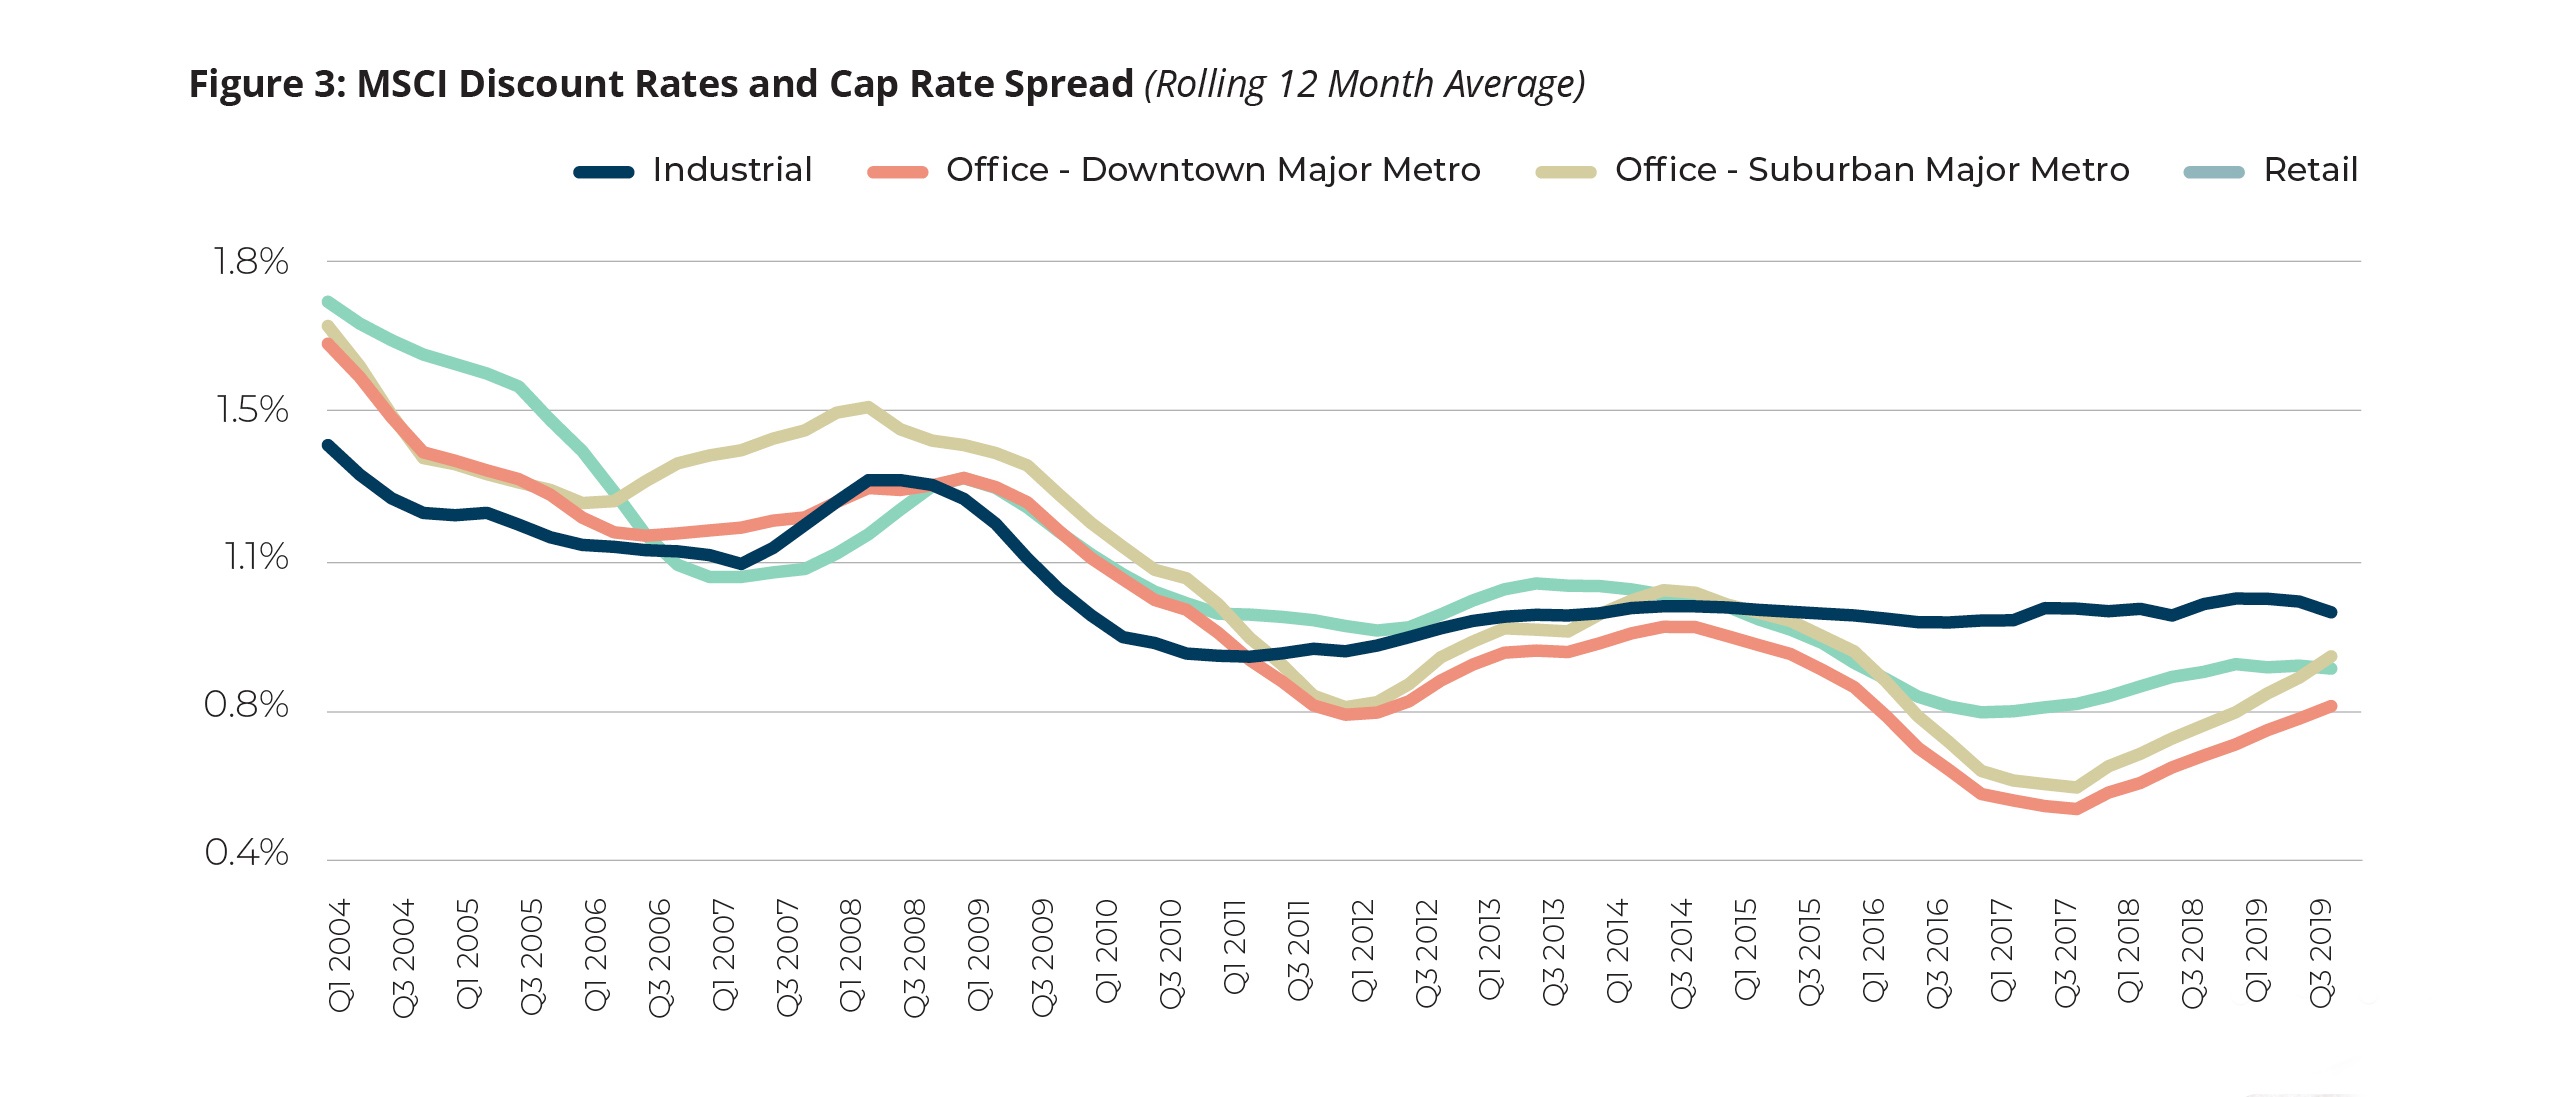
This dynamic is visualized in Figure 2 and 3, which shows average and asset specific4 discount rates and cap rates from MSCI across Canada.
Important in these figures is when the spread between discount rates and cap rates are generally at their widest point—120bps in 2008 leading into the Global Financial Crisis; 100 bps in 2013 leading into the energy slowdown; and this latest quarter (Q3 2019) at 100bps. Across all those time periods, cap rates declined at a faster pace than discount rates. From a valuation perspective, investors held discount rates steady while current values rose, pushing cap rates lower. When investors expect strong rent/income growth, whether realized in the future or not, current values for real estate trend higher relative to discount rates.
Notably, when we overlay Income Growth (NOI) to the discount rate/cap rate spread in Figure 4 we can see how closely the two move together. In fact, despite the Global Financial Crisis starting towards the latter half of 2008, income growth for real estate was still averaging well above 2% through to the fourth quarter of 2010. It was this stable income that helped partially offset value declines due to cap rates reverting higher over the same time period.

Yielding Perspective
With the third quarter of 2019 exhibiting similar characteristics as previous cyclical ‘peaks’ in property values, investors should be paying close attention to the relationship between cap rates, discount rates and income growth. In particular, the direction of rents and income is critical in understanding relative value. When prices move beyond reasonable rental growth assumptions, it may signal future property values are peaking or over-estimated. Based on the trends mentioned, discount rates appear to be stabilizing relative to continued cap rate compression in some property segments—further supporting the focus on income growth as a signal of market value.
Because this Research Note takes a national perspective, it is important to note that the concept of ‘relative value’ varies by market and asset class. Some property sectors such as industrial continue to benefit from both cyclical and structural factors driving strong demand; based on Figure 3 accordingly, the high spread for the sector indicates expectations for continued strong income growth.
Overall, understanding 1) the velocity of space demand and 2) the capacity for users to absorb rising occupancy costs in a market segment is paramount. We continue to monitor both at GWLRA extensively.
[1] MSCI Income Return (Cap Rate) Spread based on the average ten-year GoC Bond Yield over Q3 2019 (1.34%).
[2] The MSCI/REALpac Canada Direct Property Index (MSCI) is a weighted performance index across Canada. Note that we ran multiple spread scenarios – the current Energy downturn in Alberta did not significantly impact yields at the National index level.
[3] A 2019 survey of Canadian Pension Funds by Morneau Shepell noted that target discount rates have stabilized in the 3.5%-4.0% range the last five years, after an extended period of declines following the 2008 Global Financial Crisis. Source: https://www.morneaushepell.com/ca-en/insights/2019-economic-assumptions-accounting-pension-and-other-post‑retirement-benefits. An additional report by The World Bank noted that major Public Sector Pension funds had a average discount rate in the 5%-6% range as of 2017. Source: http://documents.worldbank.org/curated/en/780721510639698502/The-evolution-of-the-Canadian-pension-model-practical-lessons-for-building-world-class-pension-organizations
[4] Note that Discount Rate data for Residential assets was suppressed in some quarters—a consistent time series is not available.

Based in Vancouver, Anthio brings more than 15 years of experience to GWLRA’s Research and Strategy team specializing in property market analysis, applied research and portfolio strategy. He has a Master’s in Urban Planning and Development from the University of Toronto.