
On the Rise: A Closer Look at Inflation and Canadian Real Estate Implications
With the Canadian Consumer Price Index (CPI) reaching 4.8% on an annualized basis as of December 2021, investors are assessing the impact this may have on both the broader economy and their investment portfolios.
Conventional wisdom has long insisted that private real estate serves as an inflation hedge given that rental income rises with inflation, which accordingly buoys asset values. While there is evidence of this in prior cycles, simply assuming that higher inflation equates to higher real estate performance overlooks several important considerations. These include market fundamentals at the time of inflation, the impact of interest rate changes and the duration and causes of inflation. This Research Note offers a deeper perspective on the relationship between inflation and real estate.
Historic Perspective
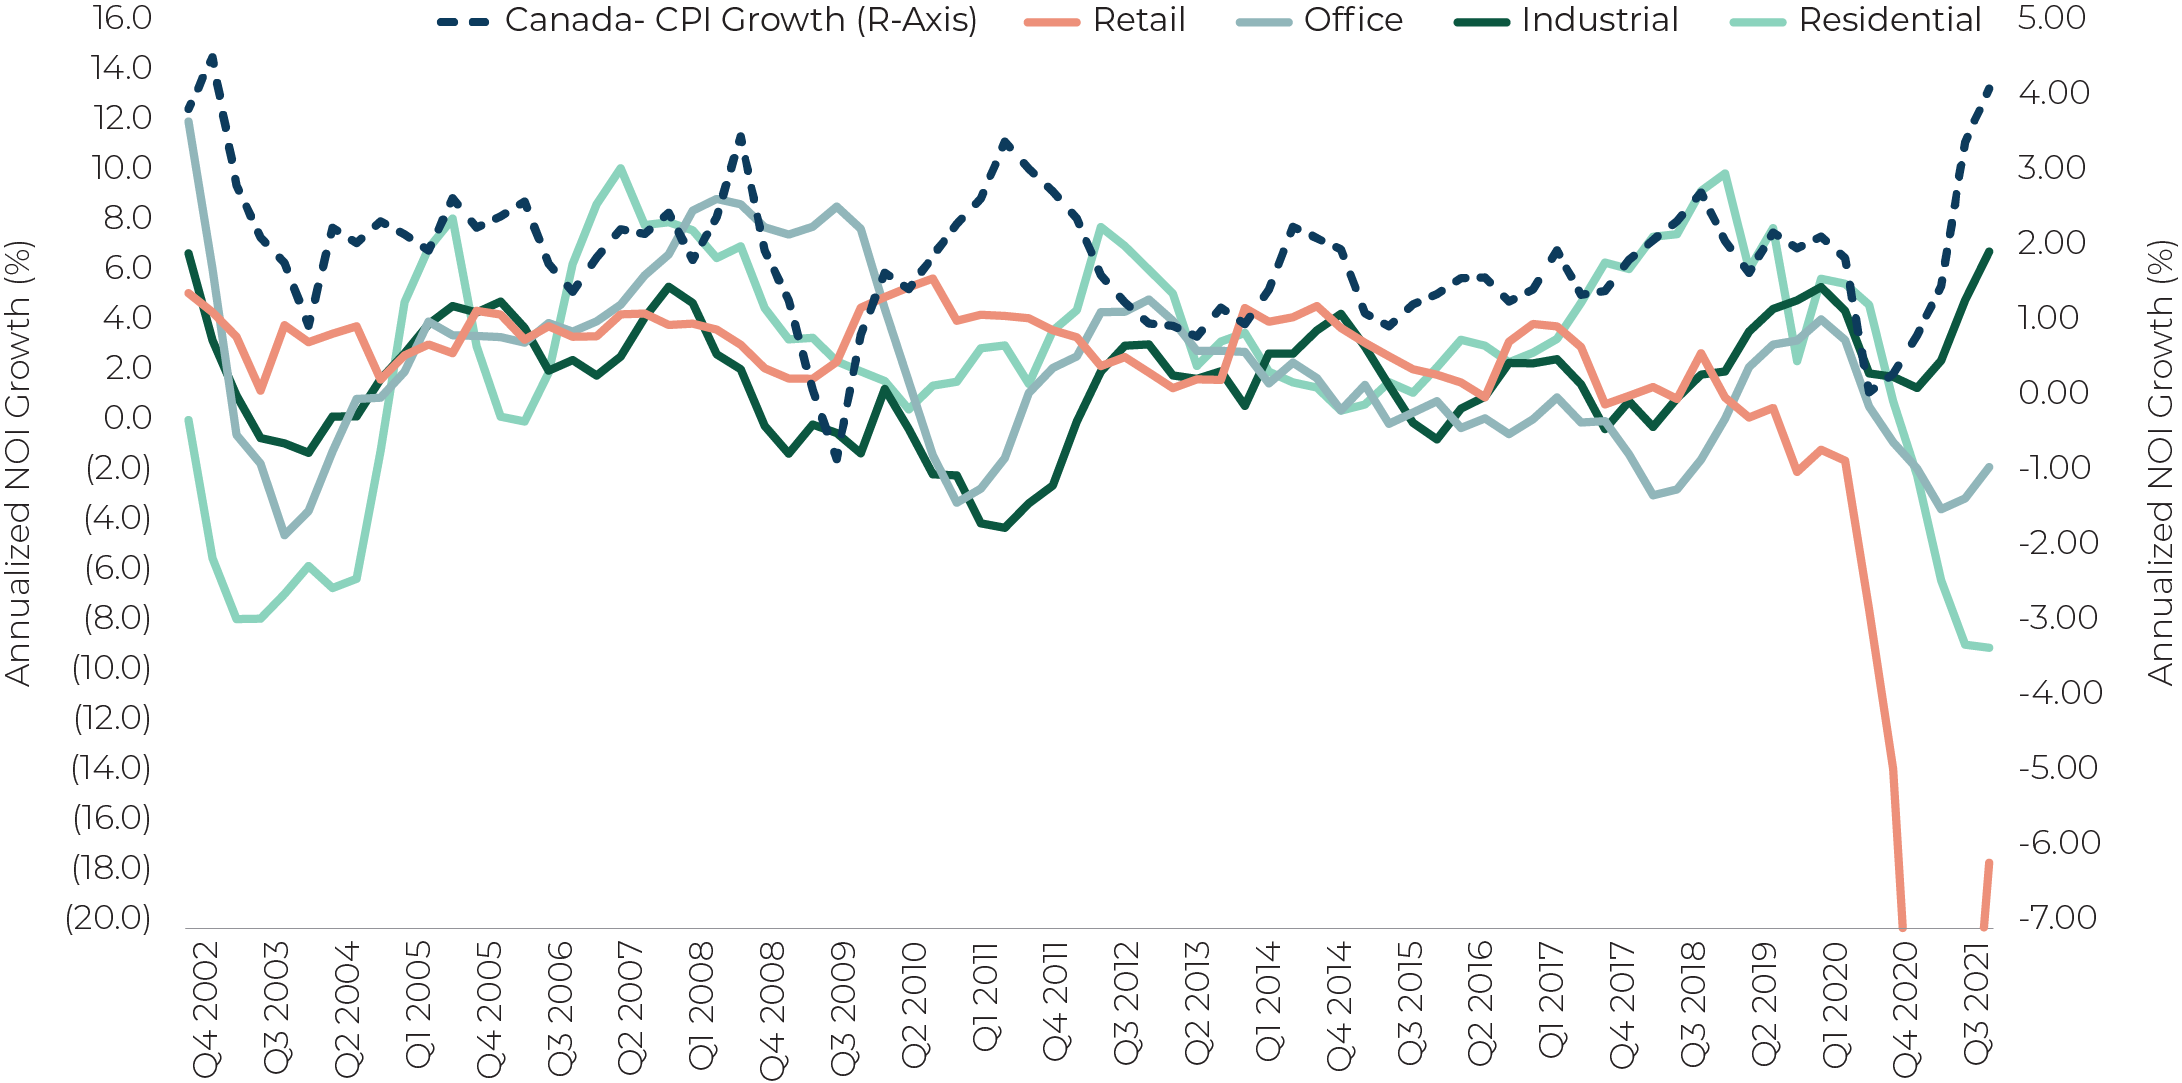
If we look historically, the relationship between Inflation and property income is varied. As Figure 1 notes, while inflation generally rises and falls along with property incomes, correlations are far from perfect. CPI tends to move within a relatively small band (e.g., a range of 400 bps historically since 2001) compared to larger swings in rents and occupancy making it difficult to link specific movements in CPI with broader real estate performance.
Figure 1. Canada CPI and MSCI Net Operating Income Growth - Annualized
Source: Statistics Canada, MSCI Canada Direct Property Index - Same Store Assets
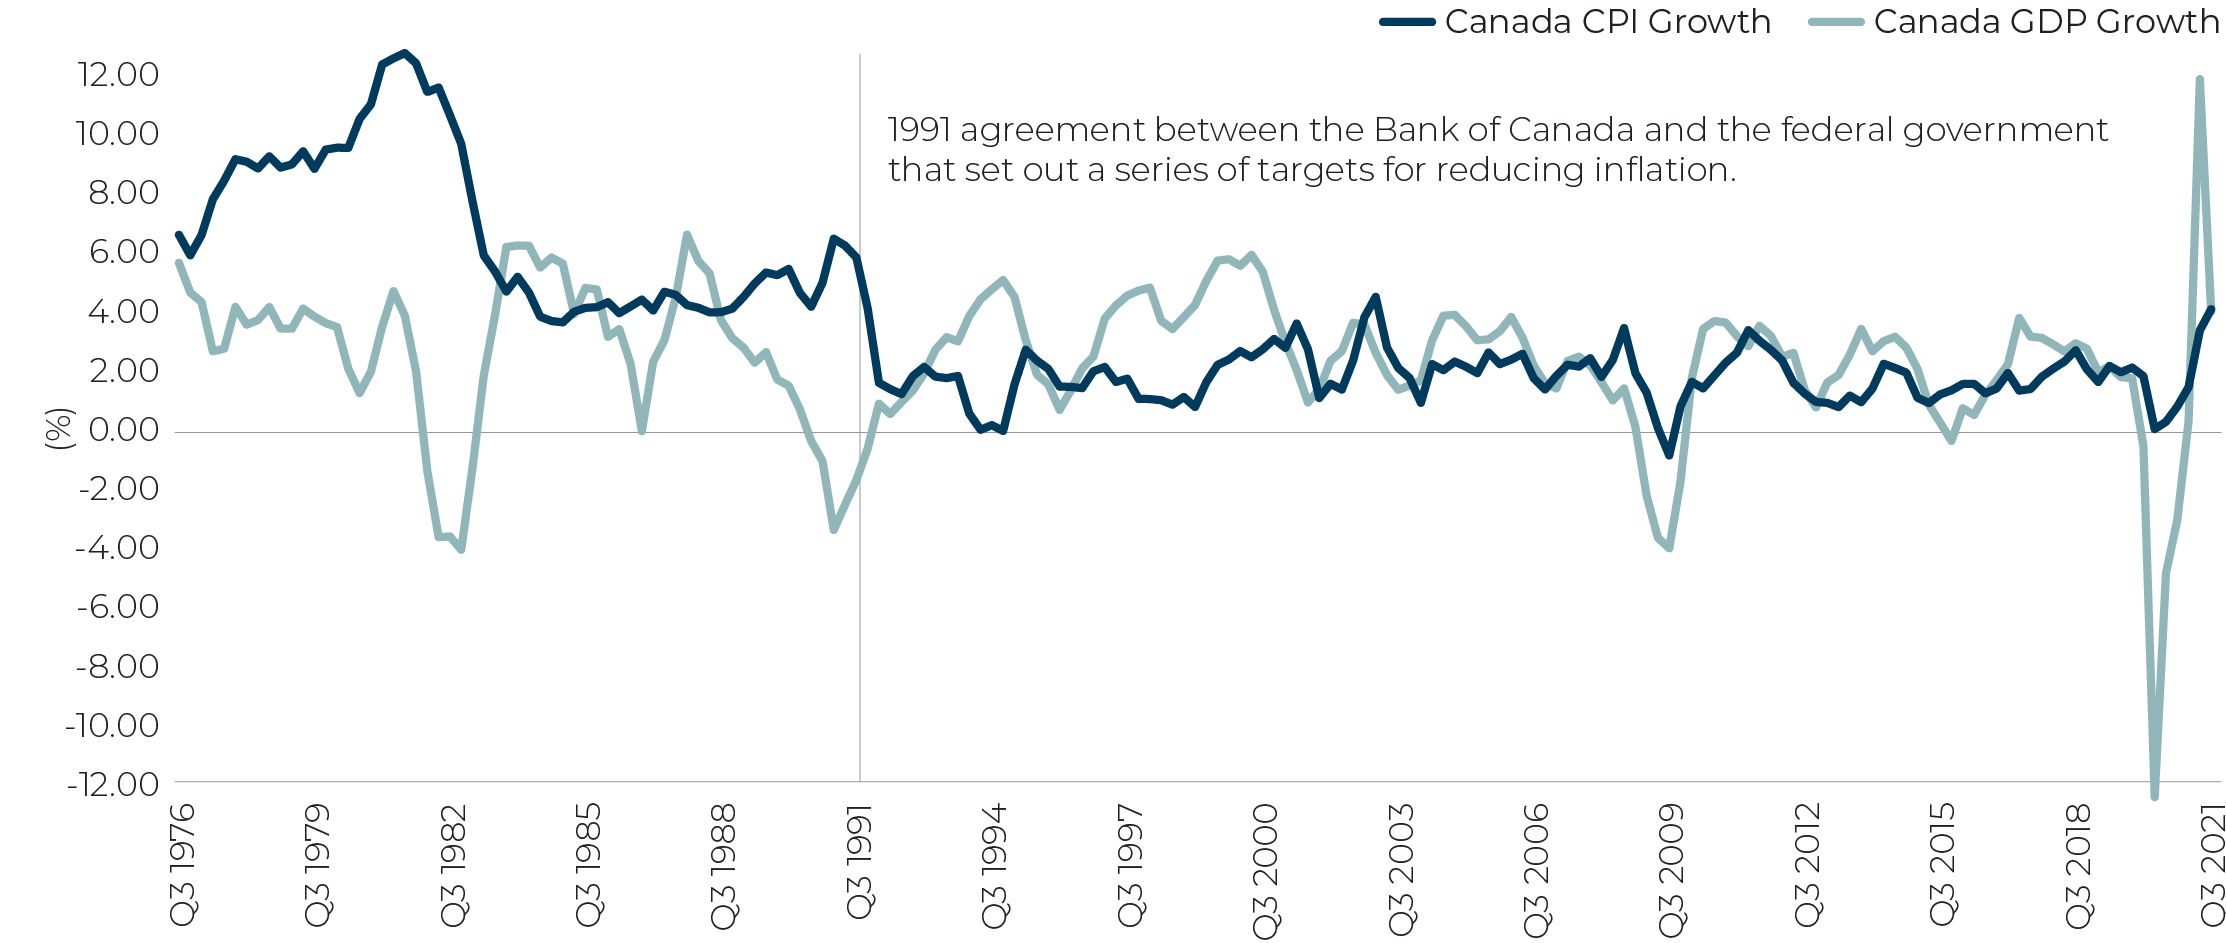
In the past, inflation has affected real estate performance in two main ways: via stronger economic growth and subsequent real estate demand, and via rents being matched or rising alongside inflation. Since the Bank of Canada introduced inflation targeting in 1991, inflation has generally followed economic growth which supports this relationship (Figure 2). From our perspective however, an important but missing piece in this dialogue are market fundamentals. Although inflation is historically linked to higher income growth, its impact on rents is only as good as the relative position of local property markets at the time. To put it simply, strong inflation can only do so much if vacancy rates are high.
Figure 2. Annualized Canadian CPI and GDP Growth (%)
Source: Statistics Canada
Performance Analysis
To put market fundamentals in context, we took historic net operating income (NOI) growth across Canadian markets and asset classes and segmented it across periods of both high and low inflation as well as periods of high and low vacancy. Given how low inflation has been in recent cycles (an average rate of 1.8% per annum since 2001), annualized CPI growth greater than 2% is technically ‘above average’ in modern context. In fact, over the last two decades, there has only been three prior periods of inflation above 3.0%; Q4 2002 to Q1 2003, Q3 2008, and Q2 2011 to Q3 2011. In all cases, inflation above 3.0% only lasted one to two quarters. Our analysis focused on the time period between Q4 2001 and Q4 20191, excluding 2020-2021; we wanted to use historic patterns to provide insights for today’s inflationary environment.
The results in Figure 3 generally show that vacancy rates have a substantive impact on NOI growth, and in most cases more so than inflation. Generally, when vacancy is low, income growth is strong regardless of inflation at the time. Tight market conditions generally drive rent growth, which alongside high occupancy levels, translates into increases in property-level income. Occupancy levels also dictate the ability for buildings to ‘pass on’ rising operating costs to tenants—another inflation hedging aspect of private real estate.
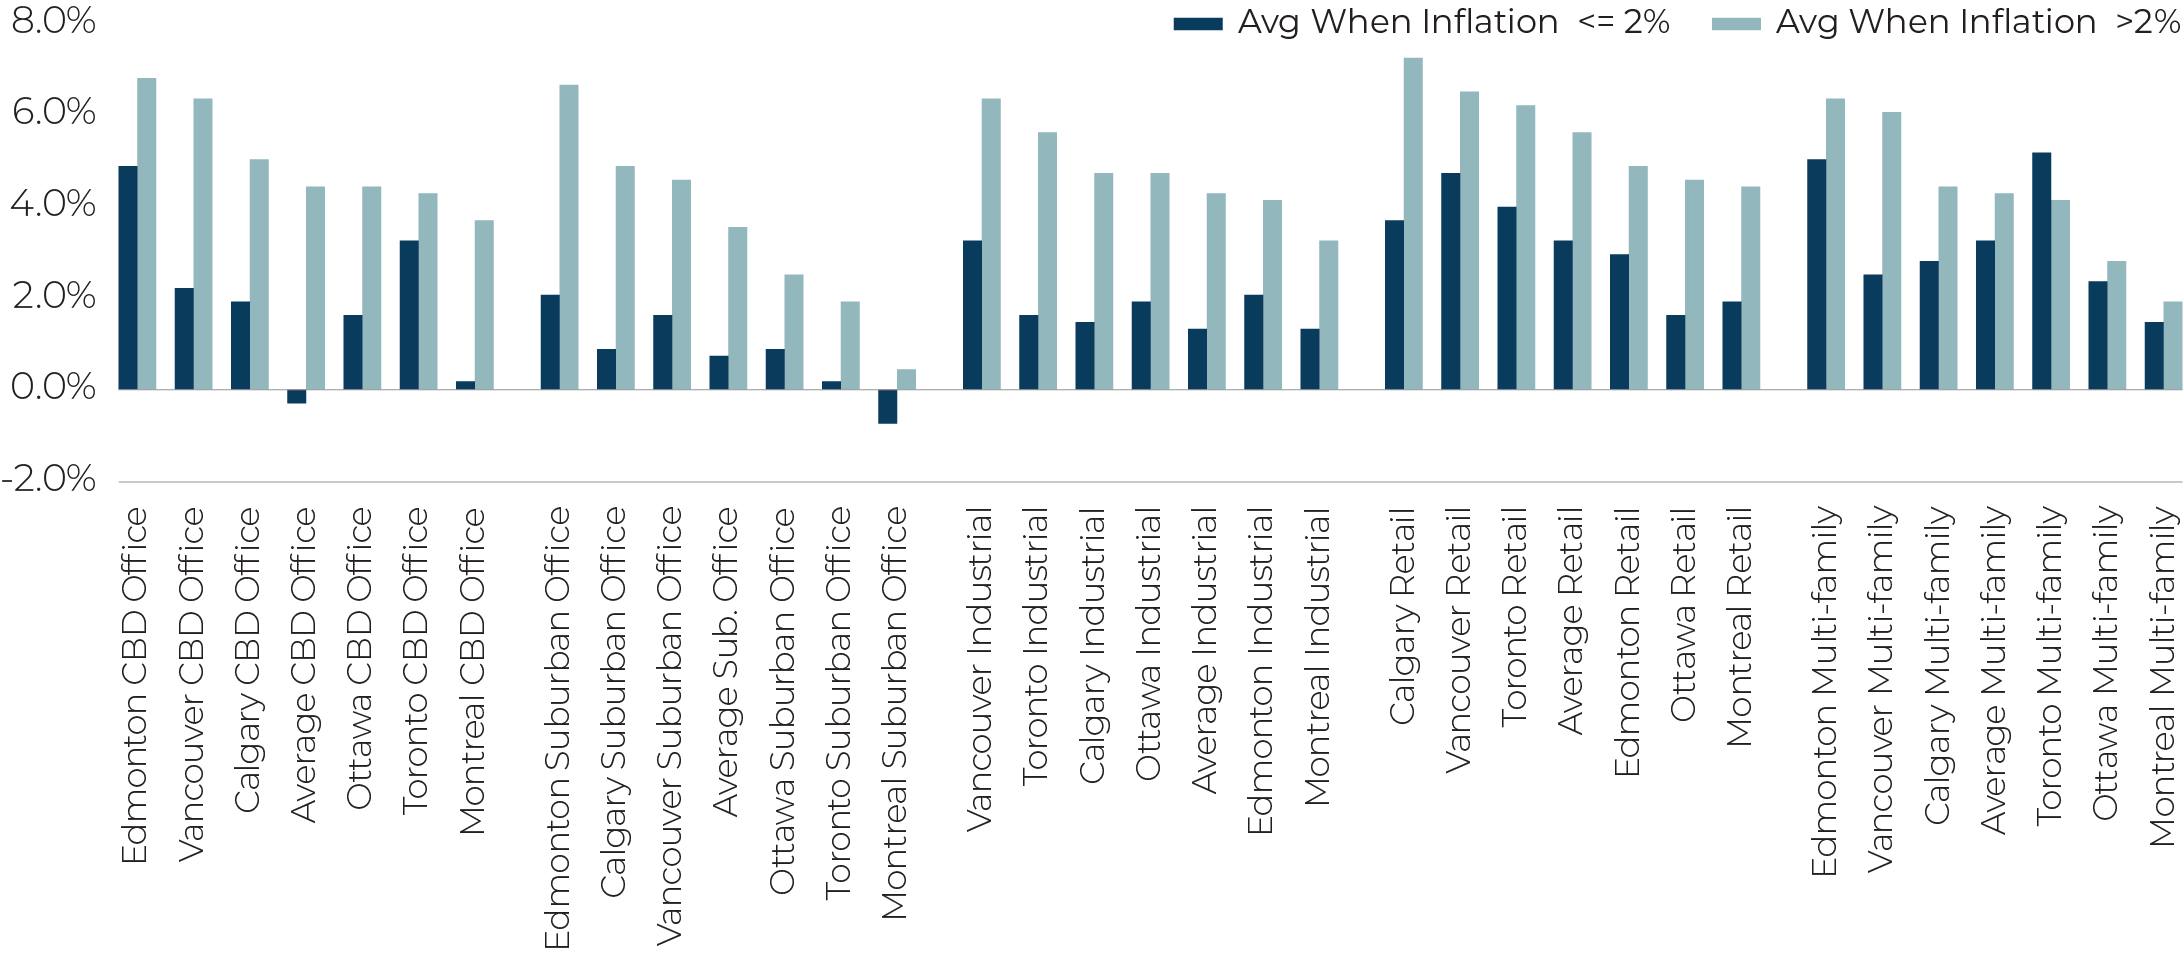
That being said, Figure 3 does show that income growth is overall higher when inflation is above our 2% threshold (particularly when vacancy is high) confirming the positive link between inflation, economic growth, and stronger property performance. For example, the average annualized NOI growth for multi-family assets is 6.3% when inflation is high regardless of vacancy, compared to 2.9% when inflation is lower. This is broadly consistent across markets and asset types save for industrial properties. For industrial, the negative effect of manufacturing declines between 2010 and 2011 (opposite to higher inflation) following the Global Financial Crisis have given way to structural tailwinds with e-commerce and supply constraints in recent years.
Figure 3. Analyzing Historic Periods of NOI Growth, Inflation and Vacancy
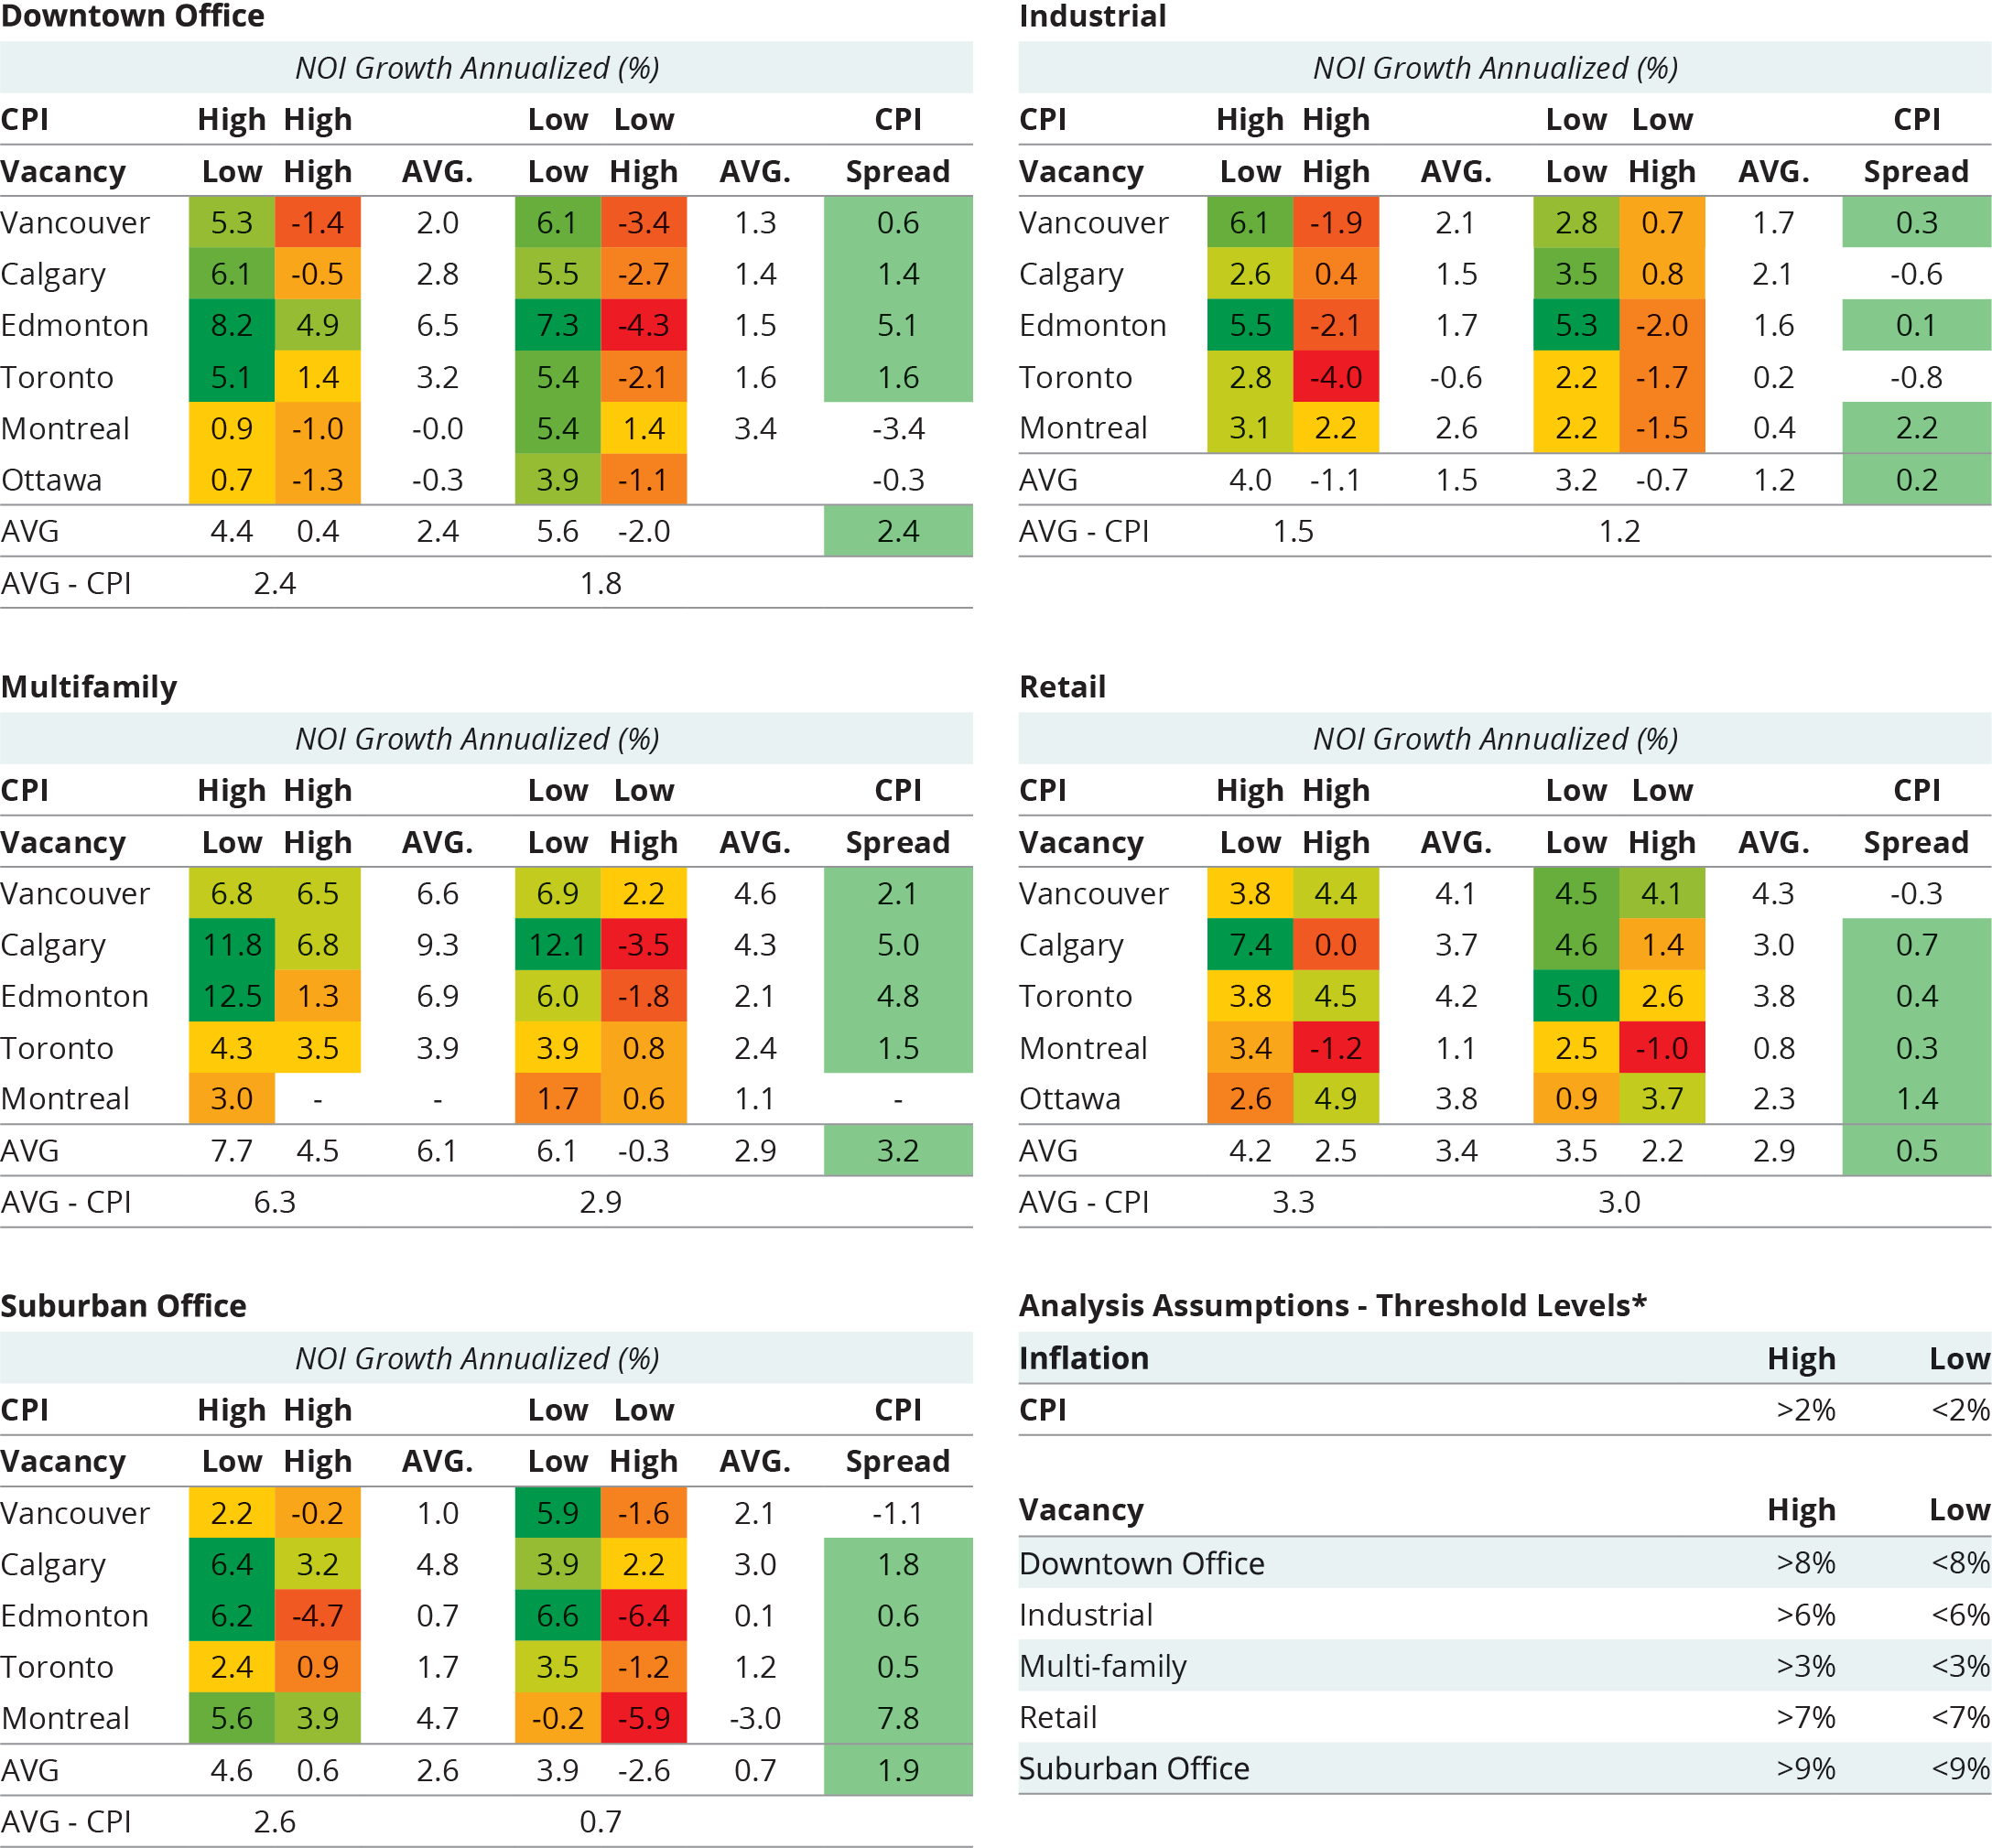
*For inflation, we used 2% annual CPI growth as our threshold (the historical average annualized CPI growth is 1.8%). For vacancy rates, we customized the threshold by market and asset class based on historical averages, sample sizes, and NOI growth as shown in the Analysis Assumptions Table. Note that for Montreal, we customized the vacancy rate threshold to 10% for DT Office and 15% for Suburban Office based on historically high average vacancy rates. The vacancy threshold for Vancouver Multi-family was also lowered to 1.5% given historically low vacancy rates. Data source: MSCI Direct Property Index, Same Store Assets. Denotes Data Between Q4 2001 and Q4 2019. For Multi-family, data was only available as of 2004 and onwards. Markets with low data sampling were excluded.
Looking at asset classes during periods of both strong inflation and strong market fundamentals, we see that multi-family is again most responsive. For example, the average annualized NOI growth for multifamily assets when inflation is high and vacancy is low is 7.7%, outperforming other scenarios. Characterized by short lease terms (and ability for subsequent tenant turnover) and persistent scarcity, multi-family assets have generally been more responsive to inflationary periods than other asset classes.2
For office, we note that the influence of inflation is overall more varied than other asset classes, with longer lease terms, larger swings in supply and vacancy, and more varied labour growth patterns being factors. Opposite to industrial, retail has seen demand headwinds brought on by online shopping in recent years, driving varied income growth.
Overall, the analysis provides some important conclusions. First, there is indeed a historic link between higher inflation and higher overall real estate performance, but market fundamentals have a substantial impact on underlying income streams. Second, the degree to which inflation impacts real estate income also varies across asset classes with multi-family most responsive to periods of high inflation historically. Structural and idiosyncratic factors appear to play larger roles for other asset classes.
Drawing implications for today, the degree to which higher inflation translates into higher income depends on the path of economic growth. Most forecasts3 suggest it will take another 12-24 months for supply chain issues and demand-supply imbalances to ease and for the economy to recover from COVID-19. Beyond this point, CPI is expected to still remain in the upper end of central bank targets (~2% per annum)4 supported by positive demand drivers. Supply factors aside, demand is stable and growing, led by excess savings, government stimulus and re-employment gained through the pandemic. Several pending demographic forces – including Canada’s higher immigration targets, full employment, and a rebound in services (restaurants, concerts, hospitality and tourism) – are expected to add further tailwinds to property demand as the economy re-opens.
Capital Markets and Valuations
Dissecting capital growth, another important driver of real estate performance, the link to inflation is also quite pronounced. Across all markets and asset classes, capital growth during periods of high inflation was stronger than periods with low inflation (Figure 4). Given capital growth is a function of both real and anticipated income growth and subsequent movements in cap rates, the positive link to inflation makes sense. Inflation generally drives higher income growth, which directly increases the valuation of assets. Iteratively, under stable market conditions, investors place more value on assets with growing income streams, which further drives capital growth through yield compression.
Figure 4. Annualized Capital Growth - Standing Investments
Source: MSCI Canada Direct Property Index - Standing Investments. Denotes Data Between Q4 2001 and Q4 2019.
Drawing parallels to today, despite expected interest rate increases5, the capital markets environment for real estate remains supportive. The target for the overnight rate is 0.25% and 150bps below pre-pandemic levels meaning it would remain historically low even with increases. The path of interest rates is also not guaranteed with the Central Bank sensitive to stemming inflation without risking economic recovery. If inflation subsides within 12-24 months as expected (or sooner), the impetus for rate increases may moderate.
From a yield perspective, compared to 10-year government of Canada bond yields, current real estate cap rates still command an attractive spread, in line with historic averages (Figure 6). As noted in a prior Research Note, the cap rate/bond yield spread only highlights the capacity for future real estate value change and does not indicate trajectory. From our analysis, income growth — which remains stable with expectations for further growth across most Canadian markets—is a much more important driver of real estate value than changes to interest rates alone.
In terms of overall private real estate performance, given total returns are the combined result of income return and capital growth, the positive link to inflation is intuitive. Figure 7 notes that when inflation was at or above 2%, total returns were 300bps higher on average historically.
Figure 5. Canada CPI Compared to Target Overnight Rate
Source: Statistics Canada, Bank of Canada
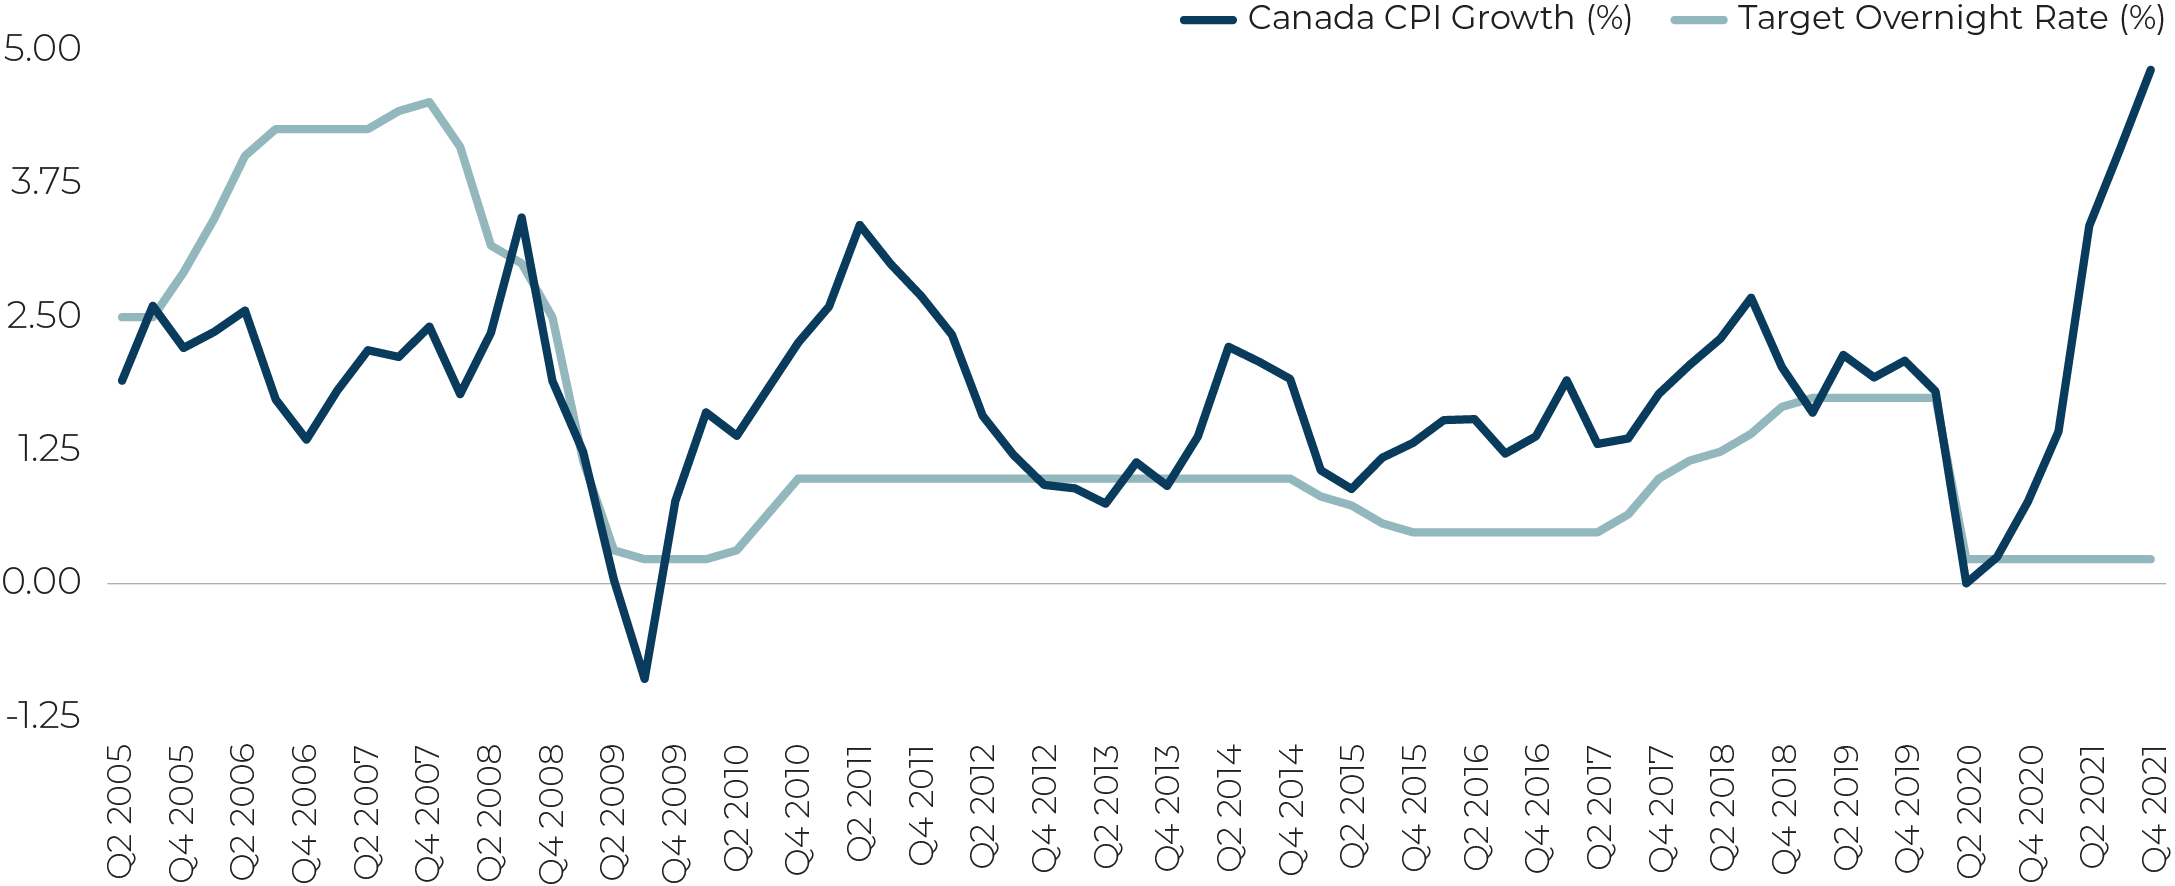
Figure 6. Cap Rate Spread to 10 Year Government of Canada Bonds
Source: CBRE
Note: Cap rates based on simple averages of ‘MTV’ (Montreal, Toronto and Vancouver) markets. All major asset classes.
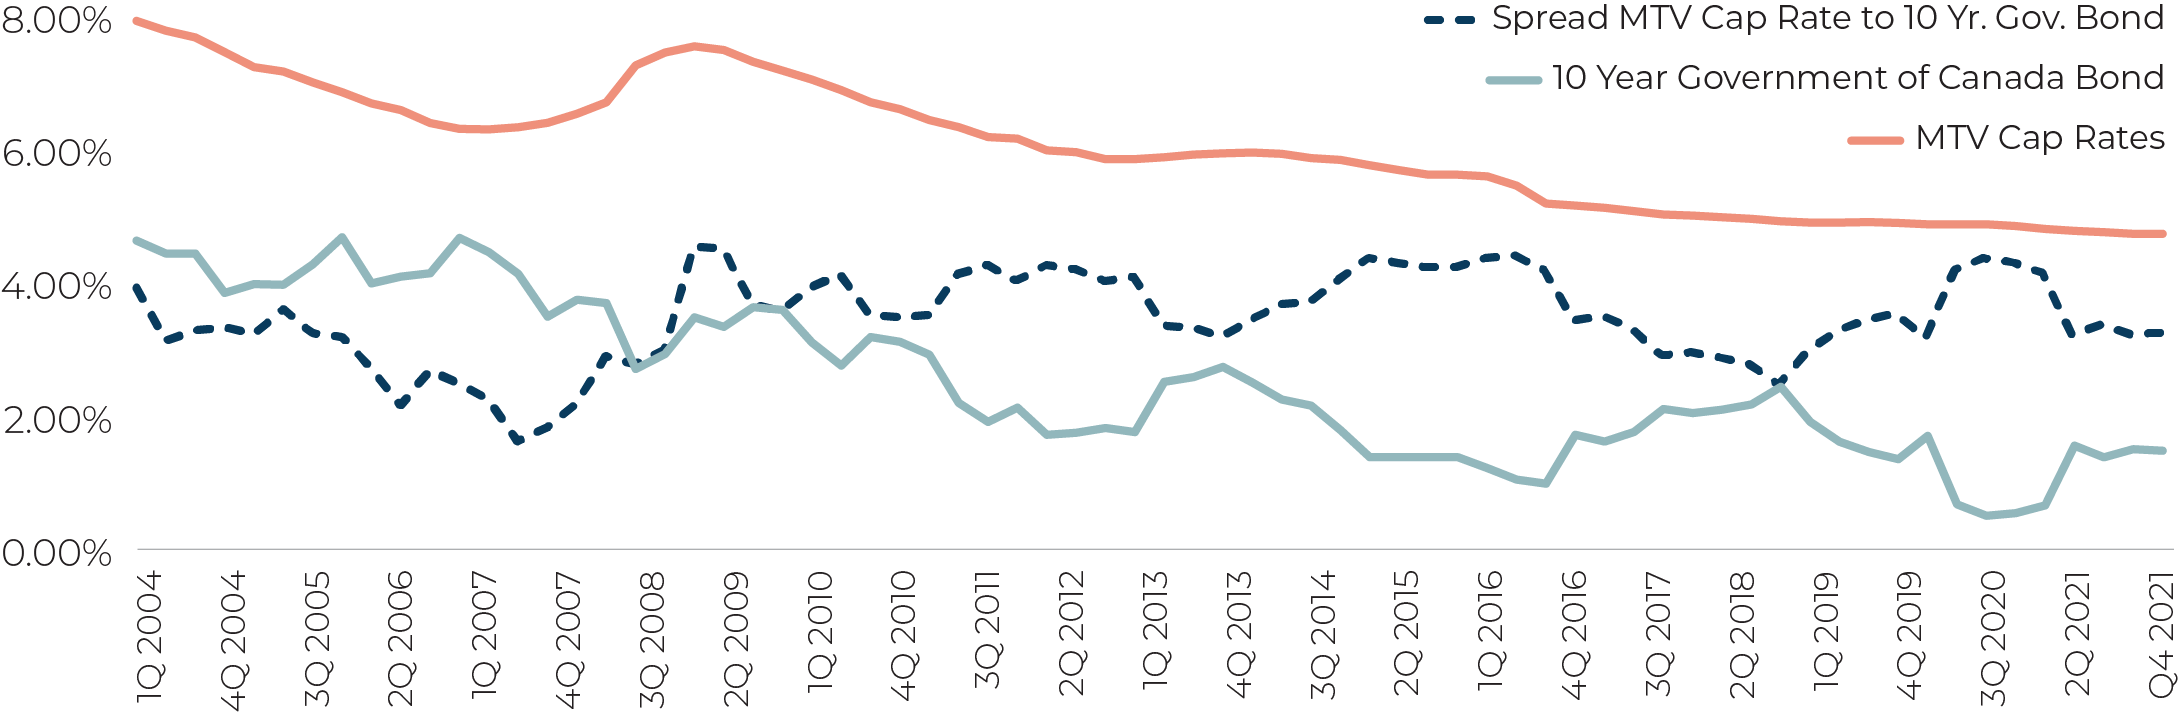
Figure 7. Annualized Total Returns - Standing Investments
Source: MSCI Canada Direct Property Index - Standing Investments. Denotes Data Between Q4 2001 and Q4 2019.
Looking Forward
Ultimately, the topic of inflation is a complicated one as there are a myriad of factors that dictate its trajectory over time. For real estate investors, less important than inflation itself are its underlying causes. If inflation supports broad economic growth as was the case in prior cycles, it generally bodes well for real estate performance. Today’s high demand-low supply inflation appears to be drawing similar parallels, but prolonged impacts of the pandemic on supply chains and the economy remain risks to this outlook.
At GWLRA we will continue to closely monitor this topic, including near-term changes to inflation and how real estate market demand and performance responds accordingly.
1 Most real estate performance data in Canada is only available after the year 2000.
2 Ontario and BC have a maximum allowable rent increase for in-place lease contracts (i.e., ‘rent control’) set by the annual increase in provincial CPI. Through the COVID-19 pandemic, some provinces legislated rent freezes on all rented housing units limiting rent growth. As of February 2022, rent freezes were lifted, meaning future rent growth in BC and Ontario will be again set by provincial CPI (pending any interim policies due to COVID-19). In Ontario, buildings built after 2018 are not subject to rent control, with landlords also able to apply for Above CPI Guideline Increases (AGI) in rent for older assets. Above inflationary income growth, accordingly, is coming from lease turnovers and new buildings alongside rising rents in those markets.
3 Source: Bank Economist Reports: Bank of Canada, CIBC, RBC.
4 Source: Bank of Canada Q4 2021 Monetary Policy Report.
5 Near-term price spikes are prompting central banks to begin increasing interest rates. Estimates on the degree of interest rates vary, but economic reports forecast increases between 100-200 bps in Canada by the end of 2023.

Based in Vancouver, Anthio brings more than 15 years of experience to GWLRA’s Research and Strategy team specializing in property market analysis, applied research and portfolio strategy. He has a Master’s in Urban Planning and Development from the University of Toronto.